Figure 1.
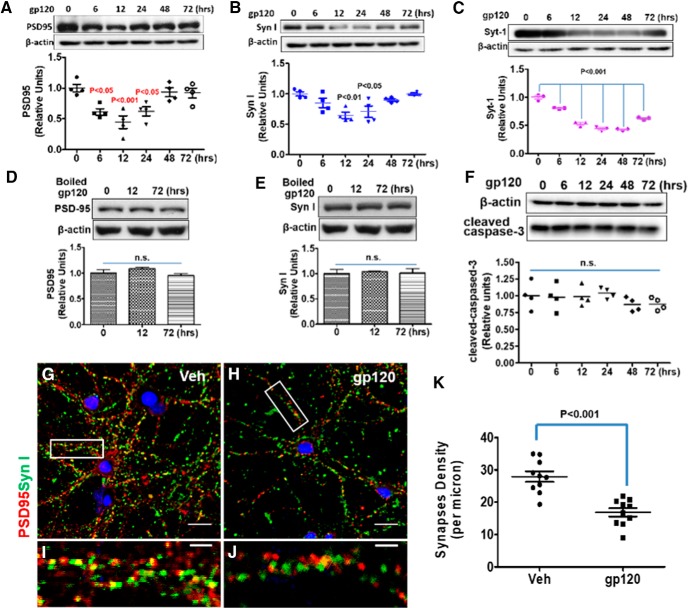
HIV-1 gp120 induces synapse loss in a time-dependent manner in primary cortical cultures. A–C, Time course of gp120-induced decreases of synaptic proteins. Cortical neuron–glia cocultures (14 DIV) were incubated with 200 pm gp120 for the indicated times. Cell lysates were analyzed by immunoblotting using antibodies against PSD-95 (A), Syn I (B), or Syt-1 (C). For A and B, N = 4; for C, N = 3 cultures/condition. D, E, Heat-inactivated gp120 did not affect PSD-95 (D) and Syn I (E) in cultures; N = 3. F, Western blot of cleaved caspase-3 from gp120-treated cell lysates; N = 4. G–J, Representative immunofluorescence images showing PSD-95 and Syn I after 12 h vehicle (Veh) or gp120 treatment (PSD-95 is red, Syn I is green, and colocalized region is yellow). I, J, Higher magnifications of boxed region. Scale bars: G, H, 20 μm; I, J, 5 μm. K, Bar graph summarizes the effects of gp120 on synapse density. N = 12 neurons from three cultured coverslips/condition (mean ± SEM). n.s., no significant difference.

