Fig. 3.
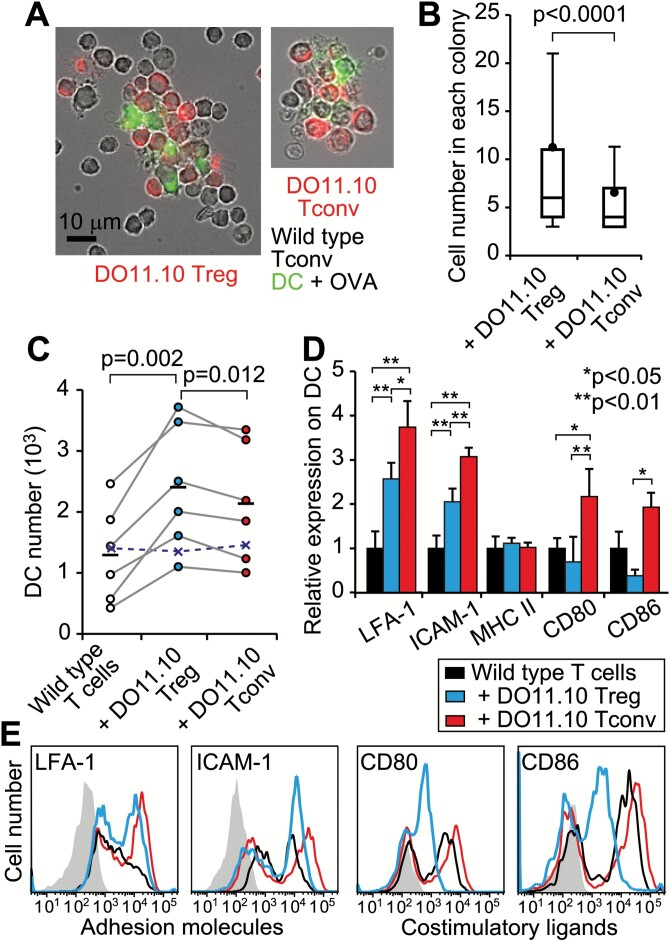
Increase in T-DC interaction induced by Tregs. (A) Representative in vitro colonies are shown with eFluor 670-labeled DO11.10 T cells, wild-type Tconvs and FITC-anti MHC II+ DCs. (B) The numbers of cells in each colony were counted after nuclear staining. Box and whisker plots indicate 10, 25, 50, 75 and 90th percentiles, in addition to the mean (data are a summary of 328 colonies with Tregs and 298 colonies with Tconvs) from 10 cultures each. A Mann–Whitney U-test was used to assess statistical significance. (C–E) OVA-pulsed CD11c+ DCs were co-cultured with wild-type Tconvs ± DO11.10 Tregs or Tconvs. (C) The number of DCs in each experiment (circles) is shown with the means (bars). Paired t-tests were used to assess statistical significance. Crosses indicate the mean number of DCs without OVA. (D) The expression of adhesion molecules (LFA-1 and ICAM-1), MHC class II and co-stimulatory ligands (CD80 and CD86) on DCs. Mean ± SD from five independent experiments are shown after normalizing to DCs without DO11.10+ T cells. Analysis of variance (ANOVA) tests with Tukey–Kramer post hoc analysis were used to assess statistical significance. (E) Representative histograms. The shaded lines indicate the IgG-stained control.

