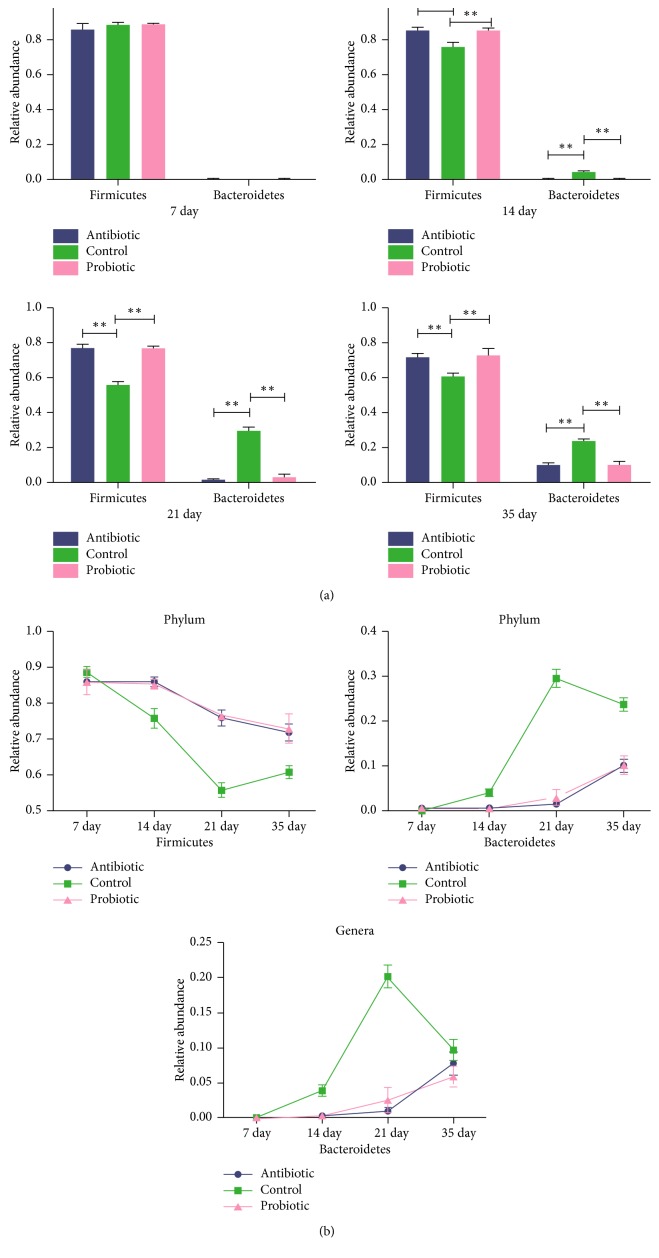
Figure 3.
(a) Relative abundance of Firmicutes and Bacteroidetes in the antibiotic (“A”), probiotic (“P”), and control (“C”) groups at days 7, 14, 21, and 35 is shown. (∗P < 0.05; ∗∗P < 0.01). (b) The prevalence of Firmicutes and Bacteroidetes (phylum level) and Bacteroides (genus level) in the antibiotic and probiotic groups and the control group as time progressed.

