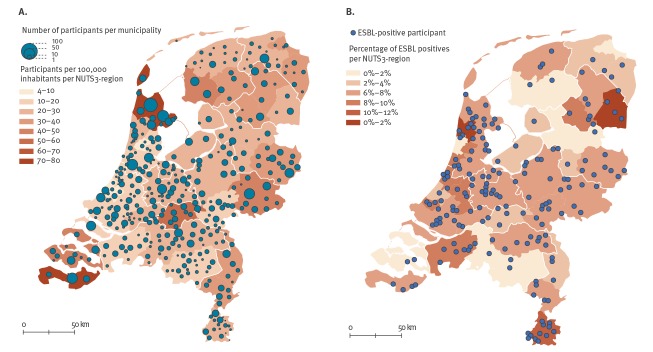
Figure 1.
Geographical distributions of (A) the study population (n = 4,177) and (B) study participants who tested positive for carriage of extended-spectrum beta-lactamase producing Enterobacteriaceae (n = 186), the Netherlands, 2014–2016
ESBL: extended-spectrum beta-lactamase producing Enterobacteriaceae; NUTS: Nomenclature des Unités Territoriales Statistiques (nomenclature of territorial units for statistics).
Panel A: The numbers of study participants per municipality are shown in groups of 100, 50, 10 or 1. In addition, the numbers of participants per 100,000 inhabitants are presented per NUTS-3 region, which is the classification system of the European Union for the purpose of compiling regional statistics.
Panel B: The percentage of ESBL-E-positive participants is shown per NUTS-3 region. The ESBL-E-positive participants are distributed all over the country, and we did not observe significant differences per province in ESBL prevalence.

