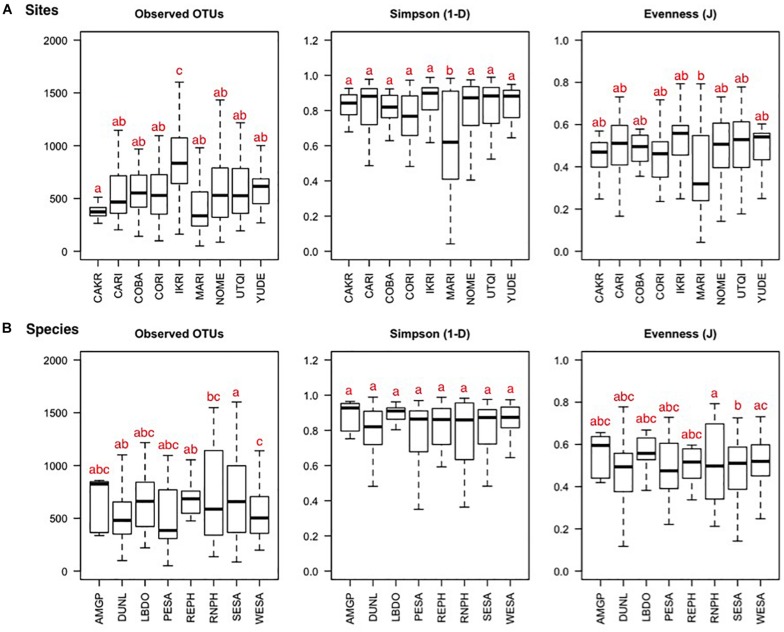
FIGURE 2.
Bacterial OTU richness, diversity, and evenness depicted per sampling site (A) and host species (B) of fecal samples collected from eight species of shorebird at nine Arctic and sub-Arctic breeding sites. The black line represents the median, 25 and 75% quartiles are shown in the boxes, and 90% confidence intervals are enclosed within the whiskers. Letters represent pair-wise significance (Tukey’s HSD), with the different letters representing significant differences at α = 0.05. Site and host species abbreviations can be found in Tables 1, 2.

