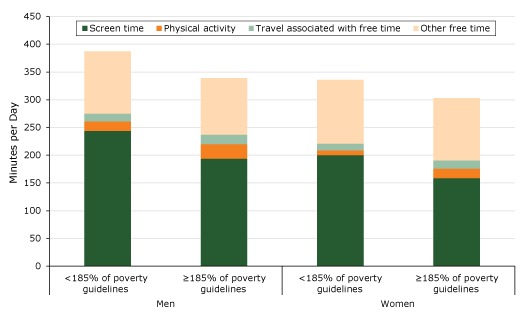
Figure 1.
Distribution of free time, in minutes per day, by income (<185% or ≥185% of federal poverty guidelines) and sex (N = 32,048), American Time Use Survey, 2014–2016. Test of equality: P < .001 for all of tests of equality of either the proportion of screen time or of physical activity: lower income men vs higher income men, lower income women vs higher income women, lower income men vs lower income women; higher income men vs higher income women. Discrepancies in data between this figure and Table 2 of this article are due to rounding.
| Category | Men |
Women |
||
|---|---|---|---|---|
| <185% of Poverty Guidelines | ≥185% of Poverty Guidelines | <185% of Poverty Guidelines | ≥185% of Poverty Guidelines | |
| Screen time | 244 | 194 | 200 | 159 |
| Physical activity | 17 | 26 | 9 | 17 |
| Travel associated with free time | 14 | 17 | 12 | 15 |
| Other free time | 112 | 102 | 115 | 112 |
| Total | 387 | 339 | 336 | 303 |

