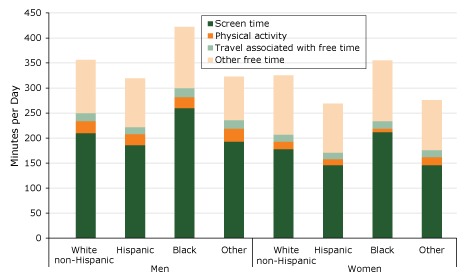
Figure 2.
Distribution of free time, in minutes per day, by sex and race/ethnicity (N = 32,048), American Time Use Survey, 2014–2016. Test of equality: P = .90 for proportion of screen time by race/ethnicity among men; P < .001 for proportion of screen time by race/ethnicity among women; P = .07 for proportion of physical activity time by race/ethnicity among men, P < .001 for proportion of physical activity time by race/ethnicity among women; P < .001 for proportion of screen time or physical activity between men and women. Discrepancies in data between this figure and Table 2 of this article are due to rounding. [A tabular version of this figure is also available.]
| Category | Men |
Women |
||||||
|---|---|---|---|---|---|---|---|---|
| Non-Hispanic White | Hispanic | Black | Other | Non-Hispanic White | Hispanic | Black | Other | |
| Screen time | 210 | 186 | 261 | 193 | 178 | 146 | 212 | 146 |
| Physical activity | 24 | 22 | 22 | 26 | 15 | 12 | 7 | 16 |
| Travel associated with free time | 16 | 14 | 18 | 17 | 14 | 13 | 15 | 14 |
| Other free time | 106 | 97 | 122 | 87 | 118 | 98 | 121 | 100 |
| Total | 356 | 319 | 423 | 323 | 325 | 269 | 355 | 276 |

