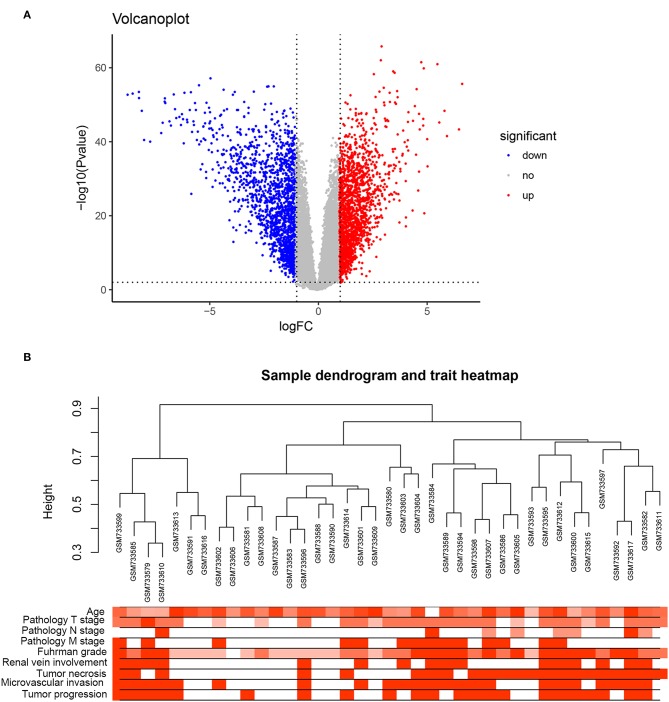
Figure 1.
DEGs and clustering dendrogram of tumor samples, as well the clinical traits. (A) The volcano plot for all DEGs based on GSE53757. (B) The clustering was based on DEGs between ccRCC and normal. The red color represents positive renal vein involvement, tumor necrosis, microvascular invasion, and tumor progression. The color intensity represents older age, higher pathological stage, and Fuhrman grade.

