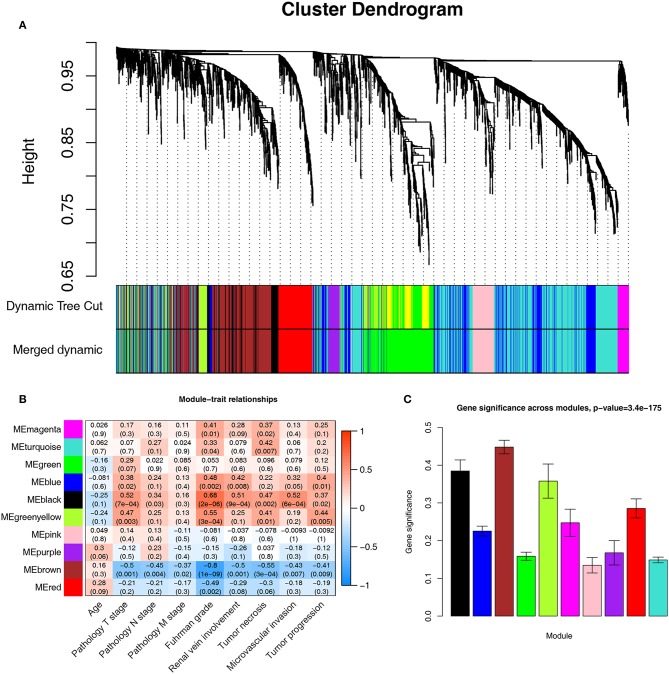
Figure 3.
Identifying modules associated with the clinical traits of ccRCC. (A) Dendrogram of all DEGs clustered based on a dissimilarity measure (1-TOM). (B) Heatmap of the correlation between module eigengenes and clinical traits of ccRCC. (C) Distribution of average gene significance and errors in the modules associated with Fuhrman grade of ccRCC.

