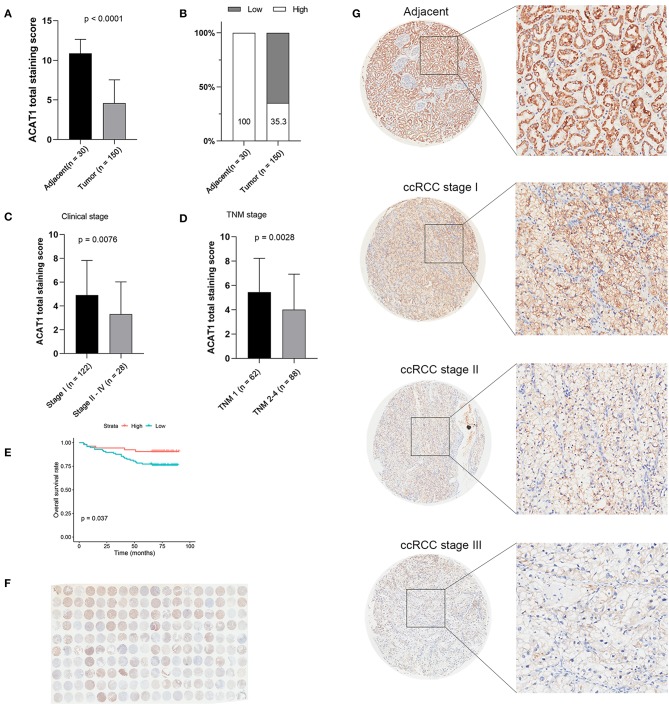
Figure 6.
Tissue microarray staining results confirmed that ACAT1 protein was downregulated in ccRCC tissues. (A) Total staining scores of ACAT1 in 150 ccRCC tissues and 30 adjacent normal tissues. (B) Percentage of low and high ACAT1 staining scores in ccRCC and adjacent tissues. (C) Total staining score of ACTA1 in ccRCC with clinical stage I and stage II–IV. (D) Total staining score of ACTA1 in ccRCC with TNM 1 and TNM 2–4. (E) Kaplan-Meier plot of overall survival for ACAT1 expression based on the tissue microarray data. (F) ACAT1 staining of ccRCC tissue microarray. (G) Representative pattern of ACAT1 protein expression in adjacent normal tissues and ccRCC tissues using tissue microarray sections.

