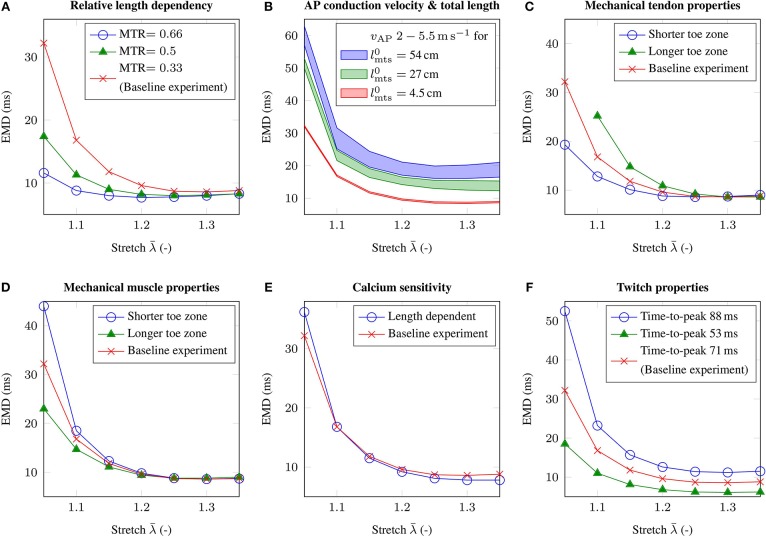
Figure 5.
The figure shows the EMD-stretch curves for parameter variations addressing (A) the muscle-tendon length ratio MTR, (B) the total length of the muscle-tendon system and the AP conduction velocity vAP, (C) the material behavior of the tendon, (D) the passive material behavior of skeletal muscle tissue, (E) length dependent Ca2+-sensitivity and (F) the twitch properties of the muscle fibers. Thereby, all parameter variations are compared to the baseline experiment (red).

