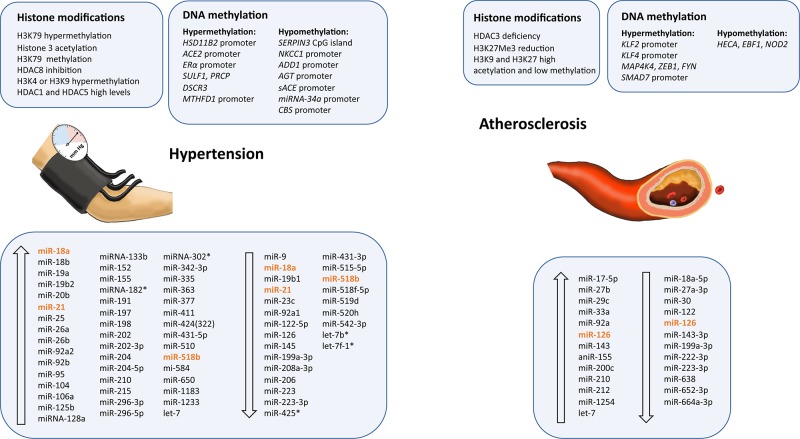
Figure 2.
Epigenetic modifications and microRNAs biomarkers dysregulated in atherosclerosis and hypertension. Ascending arrows indicate higher levels or upregulation, and descending arrows denote lower levels or downregulation, both compared to control conditions. Those miRNAs presenting opposite results are shown in orange.

