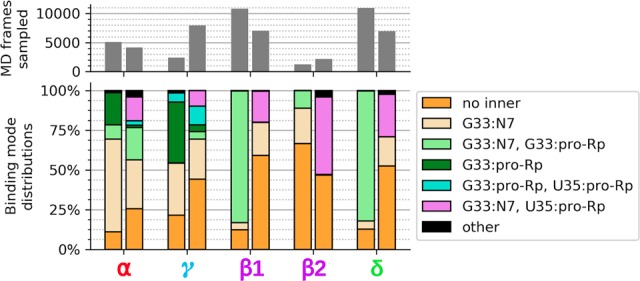
FIGURE 6.

Data on α and γ contact occupancy came from active state simulations of the 5K7C and 5KTJ constructs, while data on β1, β2, and δ contact occupancies came from transition state mimic simulations of the 5K7C and 5KTJ constructs. Each pair of bars in the upper and lower plots correspond to the 5K7C construct as the left bar and the 5KTJ construct as the right bar. The gray bars in the upper plot indicate the portion of simulation data (out of 500,000 frames, equal to 1.0 µsec for each bar) that was found to satisfy catalytic occupancy regardless of the C-site binding mode. The β1 contact is U(+1):pro-RP–MgC:HOH, and the β2 contact is U(+1):pro-RP–G40:N2.
