
FIGURE 2.
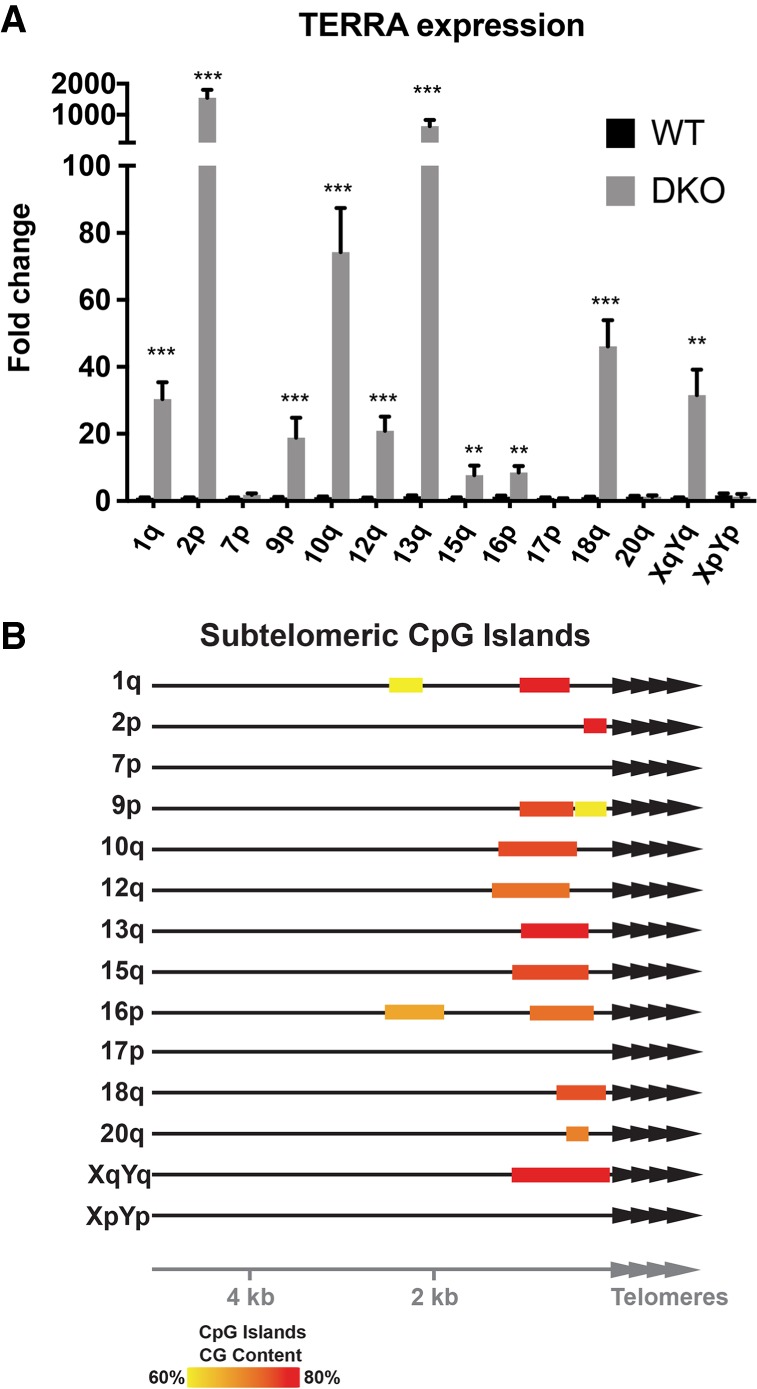
Relative TERRA expression levels in HCT116 WT and DKO cells. (A) Relative quantification of TERRA expression in HCT116 WT and DKO cells. WT TERRA levels were adjusted to 1. (**) P < 0.01, (***) P < 0.001, n = 3. (B) Representation of position and CG content of subtelomeric CpG islands at the indicated chromosome ends.