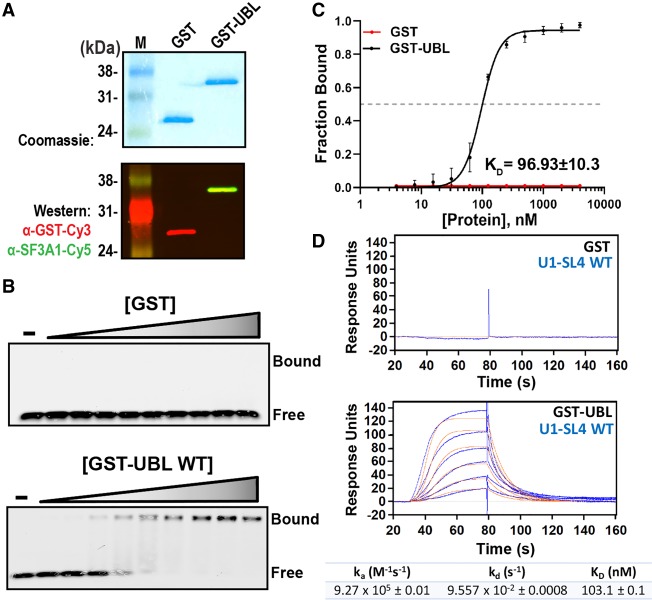
FIGURE 3.
GST-UBL fusion protein binds to free U1-SL4. (A) Expression and purification of GST alone and GST-UBL fusion proteins were confirmed by Coomassie blue staining and western blotting using anti-GST and anti-SF3A1 antibodies. (B) EMSAs for binding of GST and GST-UBL proteins to 5′-Cy5-labeled U1-SL4 RNA. The concentrations of GST and GST-UBL were 0, 0.02, 0.03, 0.06, 0.13, 0.25, 0.5, 1, 2, and 4 µM. (C) Dose-response curves generated by plotting the fraction of Cy5-U1-SL4 bound versus GST or GST-UBL protein concentration. The KD value was determined from triplicate experiments. (D) SPR analysis for binding of GST and GST-UBL to immobilized 5′-biotinylated U1-SL4. Blue lines in the sensorgrams represent the raw curve generated by association and dissociation of GST injected at 1 µM and GST-UBL injected at 0.02, 0.03, 0.06, 0.13, 0.25, and 0.5 nM. Orange traces represent the global fit to the raw data by the Langmuir binding model assuming a 1:1 stoichiometry. Binding kinetics and dissociation constant values are shown below the sensorgram.

