FIGURE 2.
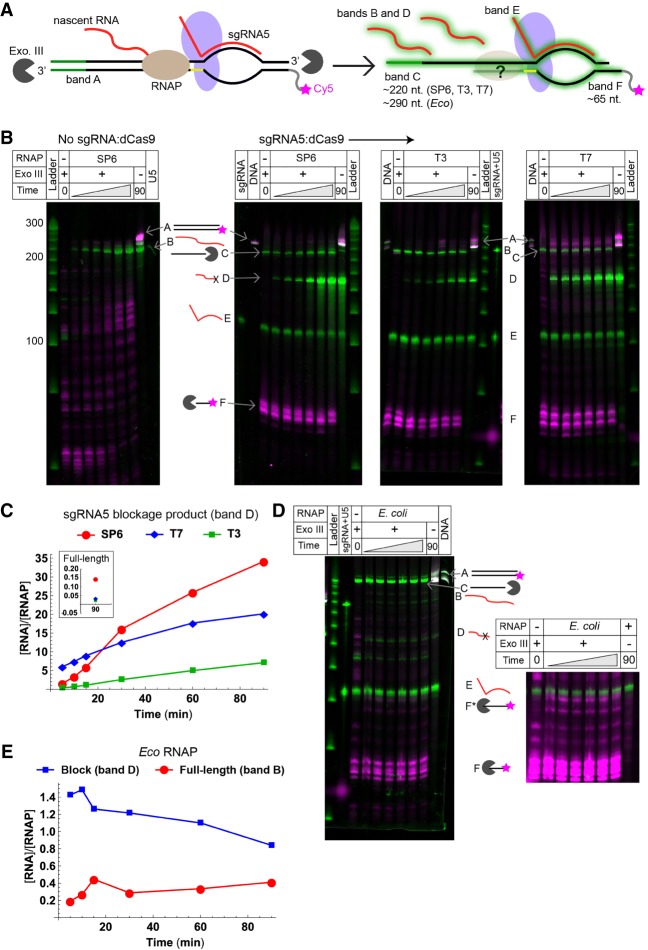
Blockage of various RNAPs by sgRNA5:dCas9 complexes. (A) Cy5-labeled DNA template encoding U5 was transcribed by SP6, T3, T7, or Eco RNAP, and reaction aliquots were removed and digested using Exonuclease III. The tDNA strand was visualized on a denaturing urea-polyacrylamide gel by detecting Cy5 (magenta star), and all nucleic acid species were visualized via staining with SYBR gold (green halos). Each species is given a letter that is used to identify its band. Band A: full-length DNA template; B: full-length U5; C: protected ntDNA fragment; D: blockage product; E: sgRNA5; and F: protected tDNA fragment. (B) Urea-polyacrylamide gels analyzing transcription reactions using SP6, T3, and T7 RNAPs, with Cy5 (magenta) and SYBR gold (green) scans overlaid. Reactions were performed with, from left to right, SP6 RNAP in the absence of a blockade, and SP6, T3, and T7 RNAPs in the presence of a blockade. Nucleic acid bands are labeled as indicated in panel A. The time points represented by the gray triangle are 5, 10, 15, 30, 60, and 90 min, left to right. (C) Quantification of the number of molecules of blockage product (band D) produced per molecule of RNAP for the reactions containing SP6, T7, and T3 RNAPs. (Inset) Quantification of molecules of full-length U5 (band B) produced per molecule of RNAP. (D) Urea-polyacrylamide gel analyzing a transcription reaction using Eco RNAP, with Cy5 (magenta) and SYBR gold (green) scans overlaid. Bands are labeled as in panel B. (Right) Band F displayed at higher contrast, showing new bands (F*) that are dependent on the presence of both Exo III and RNAP. (E) Quantification of the number of molecules of full-length U5 and blockage product produced per molecule of Eco RNAP.

