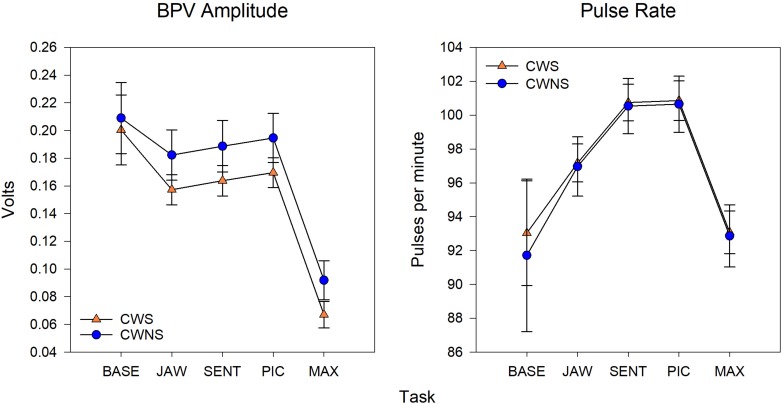
FIGURE 4.
Model means and standard error estimate bars for blood pulse volume (BPV) amplitude (left graph) and pulse rate (right graph) from each group plotted by task. BASE, initial baseline; JAW, jaw opening/closing; SENT, structured sentence production; PIC, picture description task; MAX, blowing/maximal maneuver.

