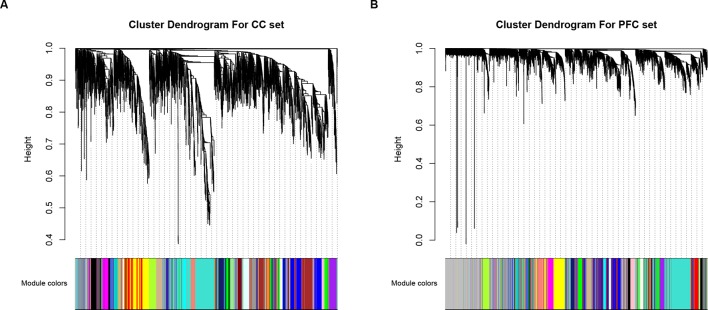
Figure 1.
Visualization of WGCNA results. Clustering dendrograms of genes within (A) CC and (B) PFC subset, X-axis represents genes and Y-axis represents height of the gene tree. Total of 30 (CC set) and 28 (PFC set) co-expression modules corresponding to different color bars while grey bars represent genes not included in any co-expression module.

