Figure 1.

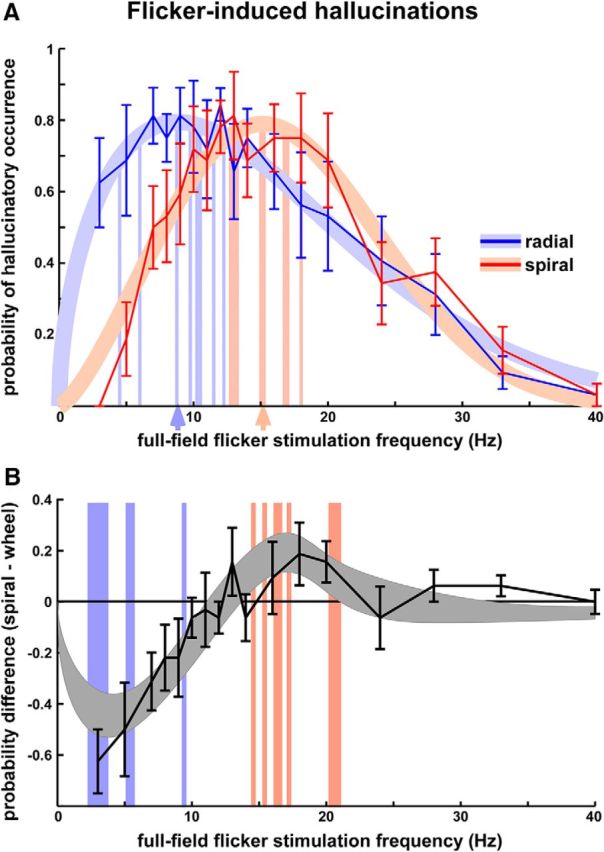
Radial and spiral hallucinatory patterns are preferentially elicited by flicker at distinct frequencies. A, Probability of occurrence of each hallucinatory pattern in relation to flicker frequency. Error bars represent SEM across observers (N = 8). Thick background lines represent the best-fitting Weibull function to the grand-average data, with vertical arrows pointing to the corresponding peak frequency on the x-axis. Each colored vertical line in the background denotes the peak frequency for reporting a radial (blue line) or a spiral pattern (red line) of an individual subject (line thickness indicates the number of subjects with the same peak frequency). The difference in peak frequency was statistically significant across observers (paired t test, t(7) = 9.5, p < 0.00003). B, Difference between report probabilities of the two shapes (black line; error bars represent SEM across observers). The shaded gray area indicates the mean difference (±SEM across observers) between Weibull-function fits of individual subjects. The minimum and maximum frequencies for this difference are 4 and 17 Hz, respectively. Each colored vertical line in the background denotes the minimum (blue line) and maximum (red line) frequencies of an individual subject (line thickness indicates the number of subjects with the same frequency).
