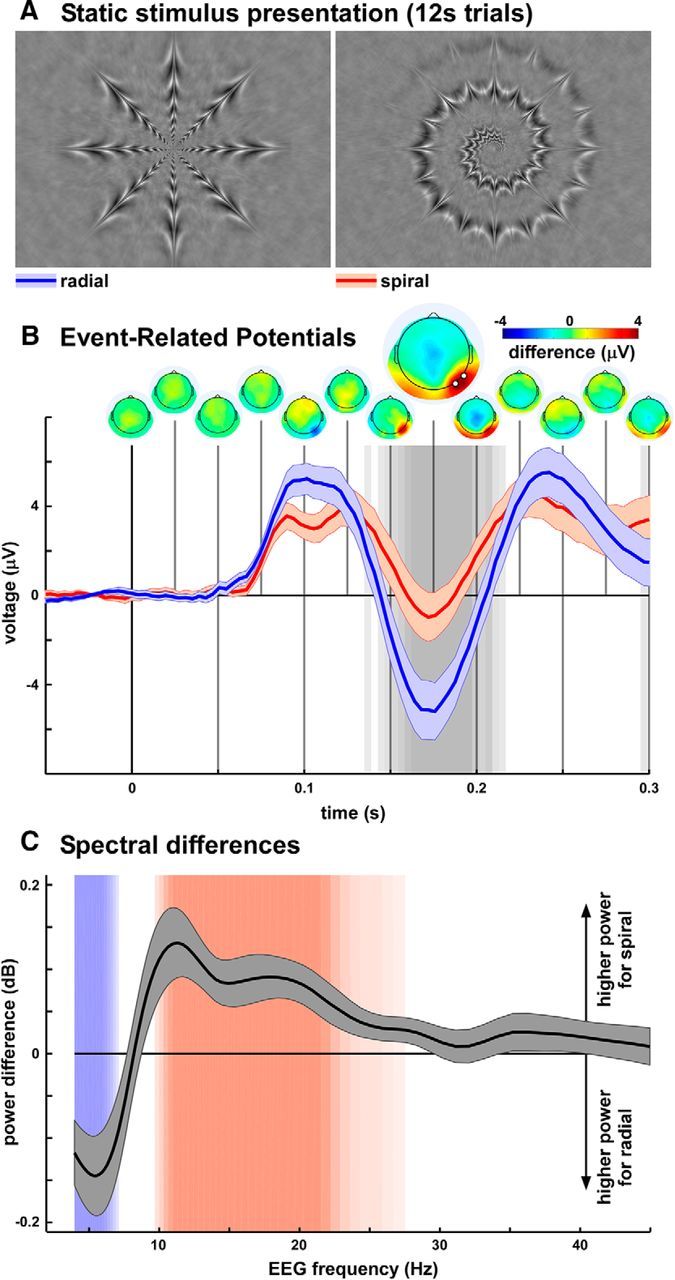
Figure 2.

Radial and spiral images preferentially enhance distinct brain oscillatory frequencies. A, Facsimile versions of the radial and spiral hallucinatory patterns. These two images, equalized for low-level properties, were presented statically for 12 s while EEG responses were recorded. B, ERPs to trial onset revealed that differential activity between radial and spiral images was restricted to occipitotemporal sites (scalp-topography time line on top) and at relatively long latencies (peaking at ∼170 ms). The background grayscale indicates significance of a paired t test across observers (N = 20; p < 0.05, FDR-corrected for multiple comparisons across electrodes and time points). The enlarged scalp map illustrates the topography at the time of maximal difference. The two highlighted points on this map mark the electrodes on which the ERP displayed underneath was computed, and which were selected for further analysis. C, Spectral power differences between EEG signals recorded during static viewing of radial versus spiral images. The background colors indicate significance of a paired t test across observers (p < 0.05, FDR-corrected; strongest color for p < 0.02, FDR-corrected), with blue denoting frequencies of higher power for radial images (peaking between 4 and 6 Hz) and red higher power for spiral images (peaking between 11 and 21 Hz).
