Figure 2.
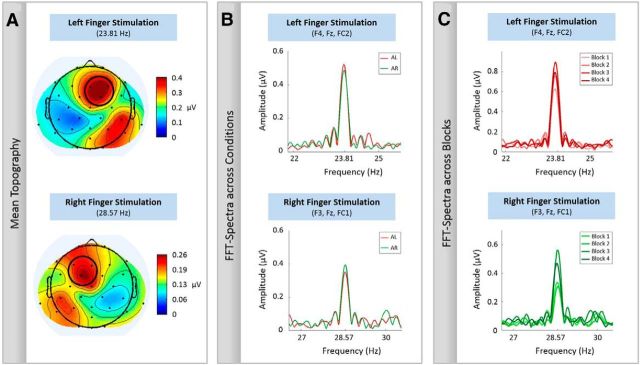
Mean topographies and FFT-spectra for the left and right index finger stimulation. Only trials without any targets and distractors are included. A, An iso-contour voltage map was calculated based on the mean SSSEP amplitudes averaged across all participants and both experimental conditions (event-absent AL and AR). Electrodes with the strongest amplitudes are encircled and used for the subsequent analyses. B, FFT-spectra with respect to the two applied stimulation frequency and the two conditions (AL and AR). Data of one participant are shown. Attending to the left (or right) stimulation frequency increases the respective SSSEP amplitude compared with attending to the right (or left) stimulation frequency. Note that for the left (or right) finger stimulation, attend right (or left) can serve as a baseline condition. We refer to this baseline condition also as ignore left (right). C, FFT-spectra with respect to the different experimental blocks. Exemplary data of one participant are shown. As variance across different experimental blocks is visible, percentage difference between single-trial SSSEP amplitudes and the respective block mean is derived.

