
Figure 2.
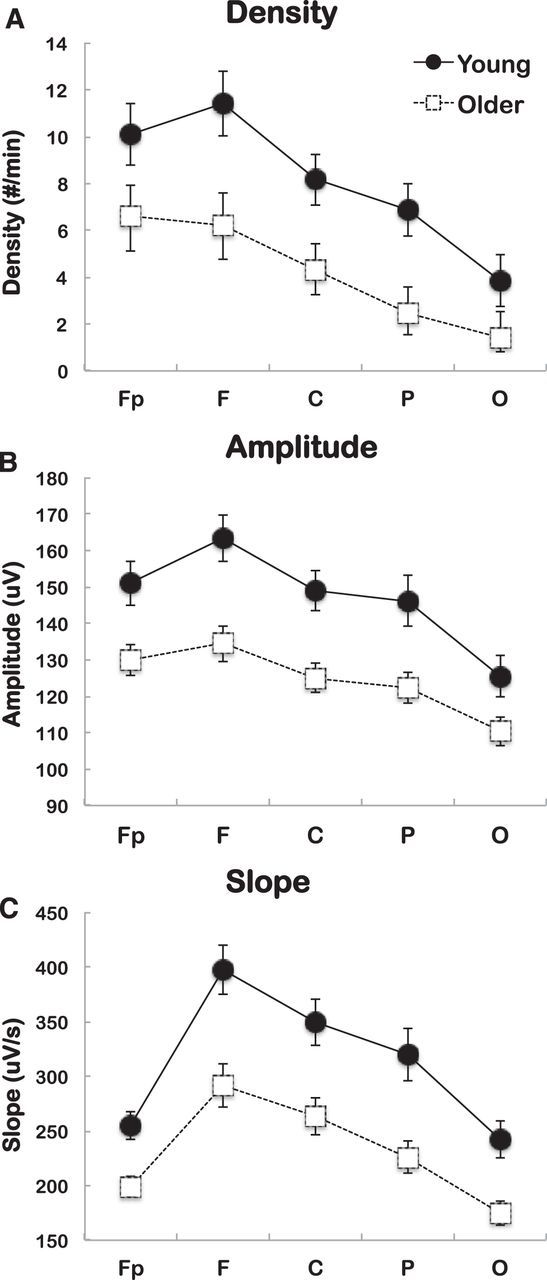
SW characteristics showing significant interaction between derivations and age group. SW density (top), SW amplitude (middle), and SW slope (bottom) are shown for young subjects (black dots) and older subjects (open squares). A, Older subjects show lower SW density in every derivation (contrast analysis, *p < 0.001), but effect size measures indicate a predominant effect of age in frontal (F) derivations. Effect sizes: Fp = 0.205, F = 0.315, C = 0.305, P = 0.266, O = 0.239). B, Older subjects show lower SW amplitude in all derivations (contrast analysis, *p < 0.001), but effect size measures show preeminent effects in frontal (F) derivations. Effect sizes: Fp = 0.352, F = 0.462, C = 0.453, P = 0.393, O = 0.245. C, Older subjects show decreased SW slope in all derivations (contrast analysis, *p < 0.001), but effect size measures indicate a predominant effect of age in frontal (F) derivations. Effect sizes: Fp = 0.465, F = 0.473, C = 0.406, P = 0.464, O = 0.435. Effect size index = η2.