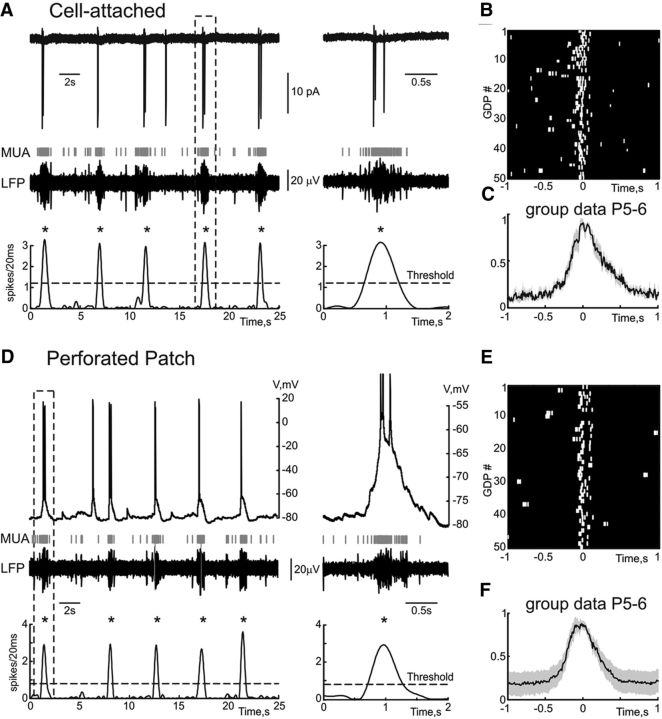
Figure 1.
Extracellular and gramicidin perforated patch recordings of GDPs. A, Example traces of cell-attached recordings from a CA3 pyramidal cell and field potential recordings from the CA3 pyramidal cell layer with a corresponding MUA frequency plot below. Note that the cell fires one to three action potentials indicated with vertical bars during each GDP (marked by asterisk). A GDP outlined by a dashed box is shown on the right. B, Raster plot of the action potentials in cell-attached recordings aligned against field GDPs. C, Normalized average crosscorrelogram of the action potentials during cell-attached recordings versus MUA. D, Gramicidin perforated patch recordings in current-clamp mode from a CA3 pyramidal cell (same as A). Note that GDPs are associated with neuronal depolarization and action potential firing, which is similar to the firing recorded in cell-attached mode. A GDP outlined by a dashed box is shown on the right. E, Raster plot of the action potentials in perforated patch recordings aligned against field GDPs. F, Normalized average crosscorrelogram of the action potentials during gramicidin perforated patch recordings versus MUA (group data from n = 7 CA3 pyramidal cells, which fired action potentials during GDPs; P5–P6; shaded area shows Jackknife deviations).

