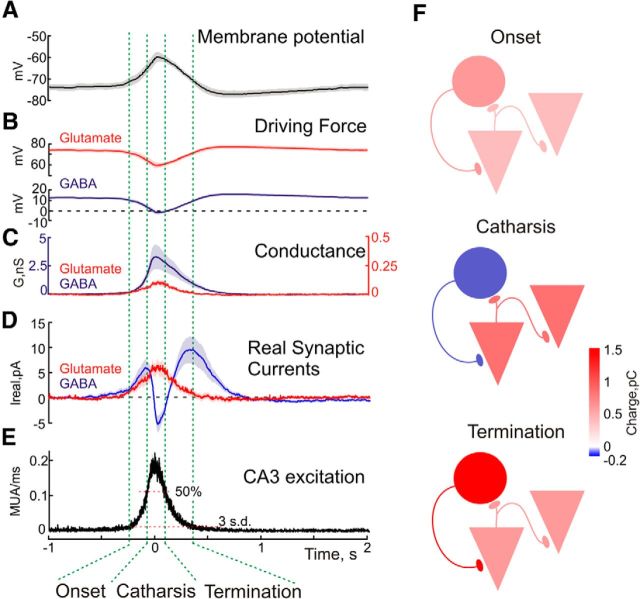
Figure 4.
Dynamic changes in GABAergic and glutamatergic currents in CA3 pyramidal cells during GDPs. A, Average membrane potential during GDPs obtained during gramicidin perforated patch recordings (average of 379 GDPs from 11 P5–P6 CA3 pyramidal cells). B, Driving forces for glutamate and GABA(A) receptor mediated synaptic currents during GDPs (average of 837 and 351 GDPs from 24 and 10 P5–P6 CA3 pyramidal cells, respectively). C, Conductances mediated by GABA(A) and glutamate receptors during GDPs. D, Real currents through GABA(A) and glutamate receptors during GDPs. E, Average perievent CA3 MUA histogram obtained from 21 hippocampal slices of P5–P6 rats (n = 1567 GDPs). Values presented in A–E are aligned against the peak in MUA frequency during GDPs. Onset, catharsis, and termination phases of the GDP are outlined by vertical green dashed lines. F, Color-coded charge transfer mediated by GABAergic (circles) and glutamatergic (pyramids) synaptic currents during different phases of GDPs. Note that at GDPs' onset inward current is mediated by depolarizing GABA and glutamate. The catharsis phase, characterized by maximal discharge of CA3 neurons, is associated with the glutamatergic inward current, whereas GABAergic currents transiently switch their direction to hyperpolarizing. This phase is also characterized by maximal value of GABA(A) conductance also suggesting shunting inhibition. Termination of GDPs is associated with neuronal repolarization.

