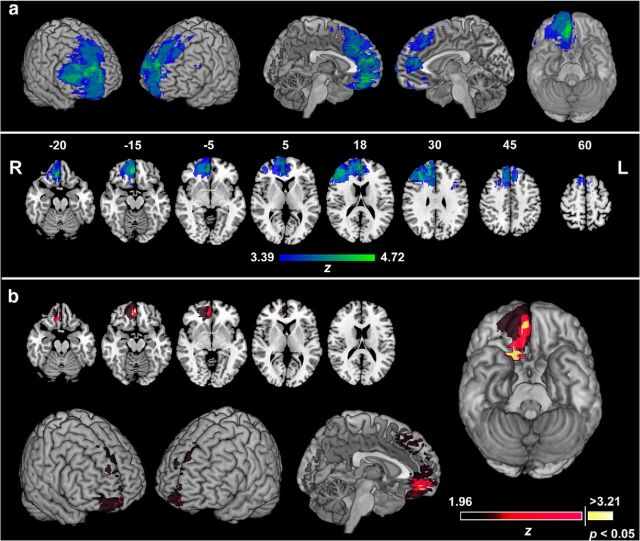
Figure 5.
VLSM analysis. a, Map showing the voxels in which there was sufficient lesion overlap to detect an effect using VLSM methods, overlaid on the MNI brain in three-dimensional views (top) and in axial slices (bottom). Numbers above the axial slices correspond to z coordinates in MNI space. The color scale indicates the maximum Z score detectable at a given voxel, indicating the power to detect effects above the permutation corrected criterion for statistical significance. R, Right; L, left. b, VLSM statistical map for diminished, or reversed, priming by reward–color associations overlaid on the MNI brain on representative axial slices (top) in three-dimensional and midsagittal view (bottom) and on ventral surface (right). The color scale indicates BM Z scores. Statistical map is thresholded at p < 0.05, uncorrected. Voxels in yellow indicate when this effect was significant at p < 0.05, corrected with permutation tests.

