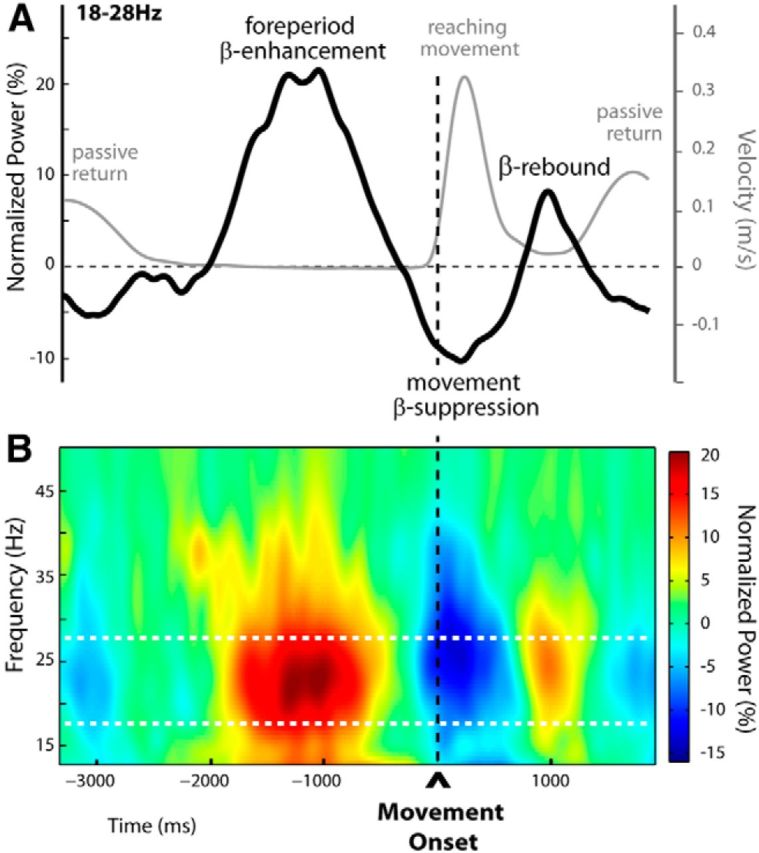
Figure 3.

Time-frequency representation of unperturbed trials (Experiment 1). A, Group averages of the tangential hand-velocity profiles (gray curve) and β-power time courses (black curve) were computed for unperturbed trials. Both the EEG and kinematic profiles were obtained by aligning to movement onset. The group β-power profile is the average over 18–28 Hz. Two clear peaks in β-power could be distinguished, separated by a period of oscillatory power decrease. The first β-power enhancement was observed during the fixed foreperiod between READY and GO (signal occurrences not shown, at approximately −2000 and −500 before movement onset, respectively), throughout which participants maintained their hand stationary at its starting location. The second peak in β-power reflected the postmovement β-rebound as usual at the end of movement. The epoch of β-band suppression (movement-related β-ERD) separating these two peaks started before movement onset, reaching a minimum around peak hand tangential velocity. B, Group time-frequency map of unperturbed trials aligned to movement onset, obtained by averaging the normalized power over electrodes selected individually for each participant, based on their activity profile during the foreperiod in the unperturbed trials (indicated in Fig. 5A). The foreperiod β-enhancement and the postmovement β-rebound are clearly visible, separated by the typical β-band suppression occurring shortly before and during movement. Note that in A and B the amplitude of the β-rebound is not optimally represented as signals are aligned to movement onset and not to movement offset.
