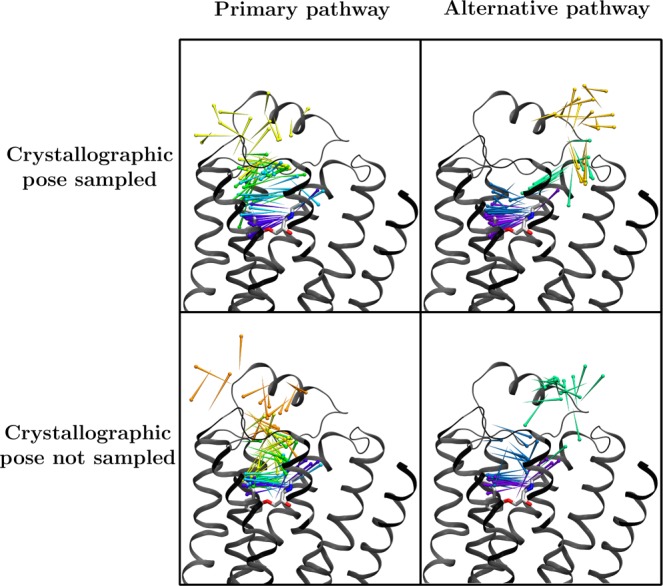
Figure 2.

Primary (left) and alternative (right) pathways for ligand entry to the binding pocket of β2AR, as determined by 60 rounds of two adaptive sampling trials using the hub scores criteria. At the top are the predicted pathways from a trial where the crystallographic pose for the ligand was sampled, and at the bottom are those from a trial where the ligand entered the binding pocket but did not sample the crystallographic pose. In both cases, the model was queried for all paths from the most populous cluster (representing bulk solvent) to the cluster with the lowest mean RMSD to the crystallographic pose. The pathways shown were selected from the top ten highest flux paths based on the number of well-defined clusters visited. The crystallographic pose is shown as sticks, and ligand positions along the pathway are shown as pins, with the pinpoint at the nitrogen atom and the round end at the benzene ring center. The pins are colored by the cluster assignment within the pathway, with 20 pins shown per cluster.
