
Figure 5.
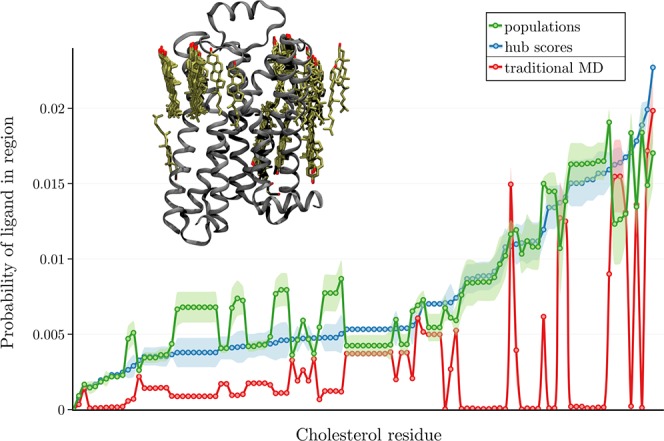
On the upper left, β2AR is shown as ribbons with sticks showing the locations of all resolved cholesterols (either as cholesterol or cholesterol hemisuccinate) in Class A GPCR structures deposited in the Protein Data Bank (PDB).48 Plotted is a sampling of each of those cholesterol locations in terms of the probability of any ligand atom occupying the region in a given frame. (See the SI.)