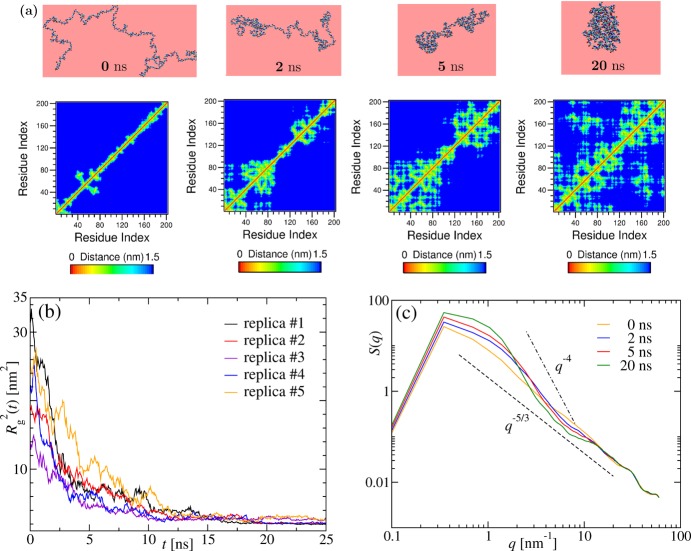
Figure 2.
Pearl-necklace formation during collapse of a long chain. (a) Same as in Figure 1a but for (Gly)200 and correspondingly at different times, as mentioned. (b) Time dependence of the squared radius of gyration Rg2(t) obtained from five different replicas chosen randomly out of the total 15 independent simulations for (Gly)200. (c) Structure factors S(q) averaged over the total 15 independent simulations for (Gly)200 at times indicated in the figure. The dashed lines have the same meaning as in Figure 1c but are plotted with different prefactors.

