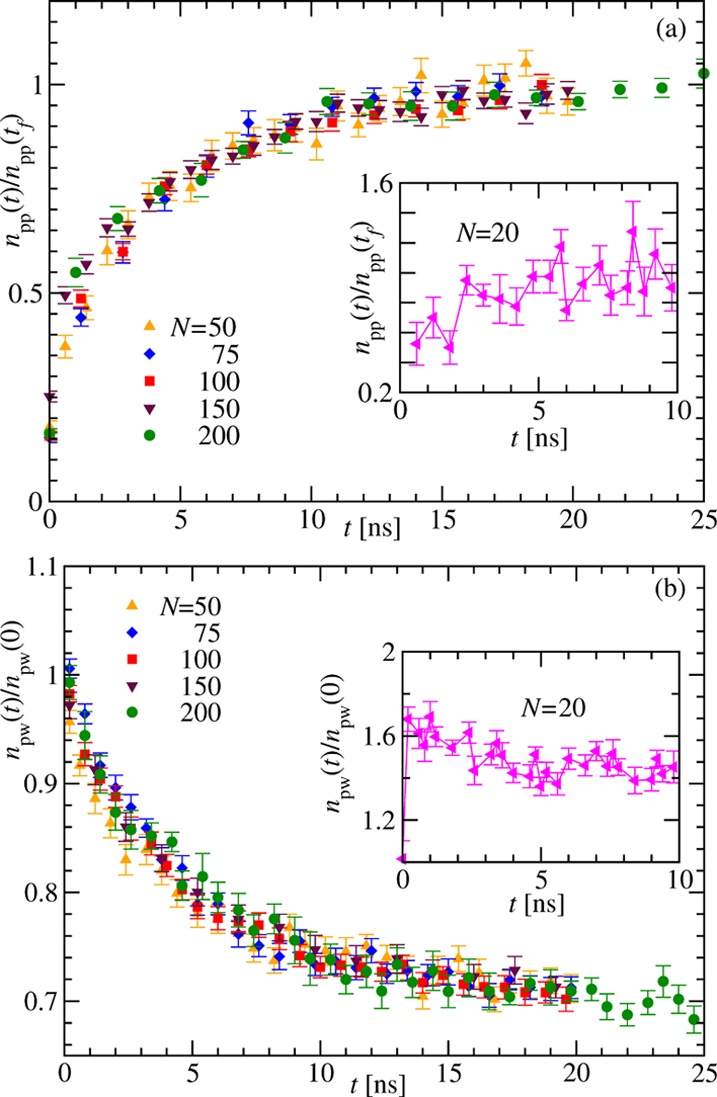
Figure 3.

Kinetics of H bonding. (a) Time dependence of the number of protein–protein hydrogen bonds npp(t) during the collapse of (Gly)N for different N. To make the curves fall within the same scale, the data is normalized with npp(tf); tf is the maximum run time the simulations are done. The inset shows the time dependence of npp(t) for (Gly)20. (b) Same as in panel (a) but for the number of protein–water hydrogen bonds npw(t). Here, the normalization is done with npw(0). The inset shows the variation of npw(t) with time for (Gly)20. The error bars in all the plots here correspond to the standard error of the mean calculated while averaging the data obtained from a number (mentioned in the Model and Methods section) of independent simulations.
