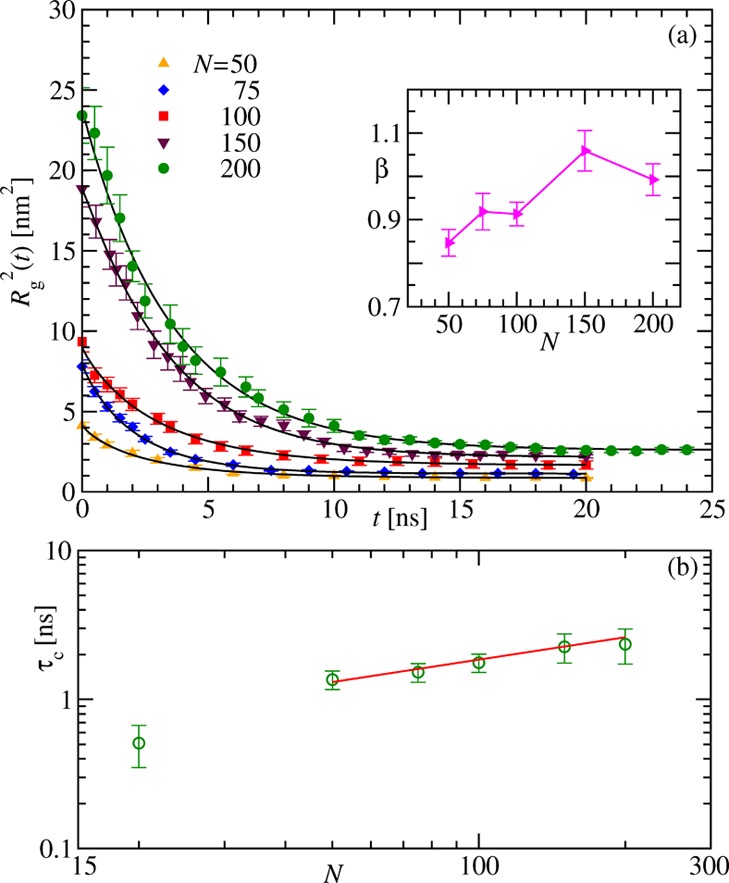
Figure 4.

Scaling of the collapse time. (a) Variation of the average squared radius of gyration Rg2(t) with time for different chain lengths as indicated. The solid black lines are respective fits using eq 5, and the corresponding β obtained is shown as a function of N in the inset. (b) Dependence of the collapse times τc extracted from the time decay of Rg2 on the number of residues N. The solid line represents the behavior τc ∼ Nz with z = 0.5. For all the data shown in the main frames, the error bars correspond to the standard error of the mean, while in the inset, they result from the fitting exercise.
