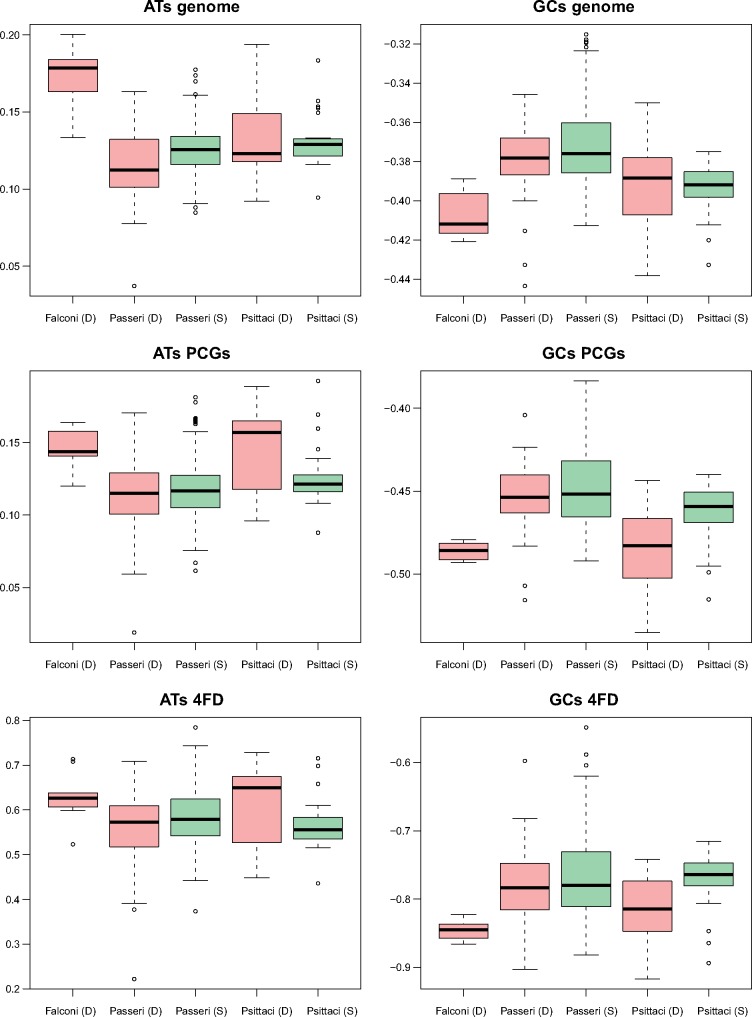
Fig. 11.
—Box-plots of AT-skew (ATs) and GC-skew (GCs) calculated for the entire genome as well as all sites in protein coding sequences (PCGs) and 4-fold degenerate (4FD) sites in mitogenomes with duplicated (D) or single (S) control regions for Falconiformes (Falconi), Passeriformes (Passeri), and Psittaciformes (Psittaci). The thick line indicates median, the boxes show quartile range, and the whiskers denote the range without outliers.

