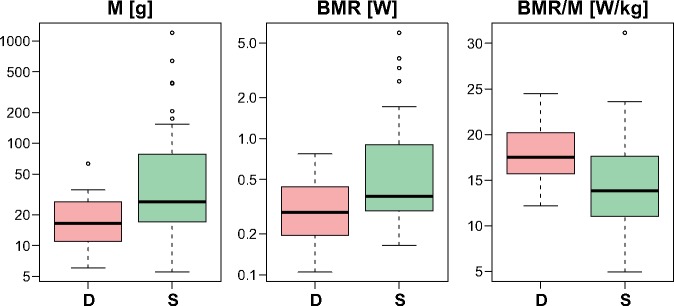
Fig. 12.
—Box-plots of body mass (M), basal metabolic rate (BMR), and mass-specific metabolic rate (BMR/M) calculated for passerines with duplicated (D) or single (S) control regions in their mitogenomes. M and BMR are shown in logarithmic scale. The thick line indicates median, the boxes show quartile range, and the whiskers denote the range without outliers.

