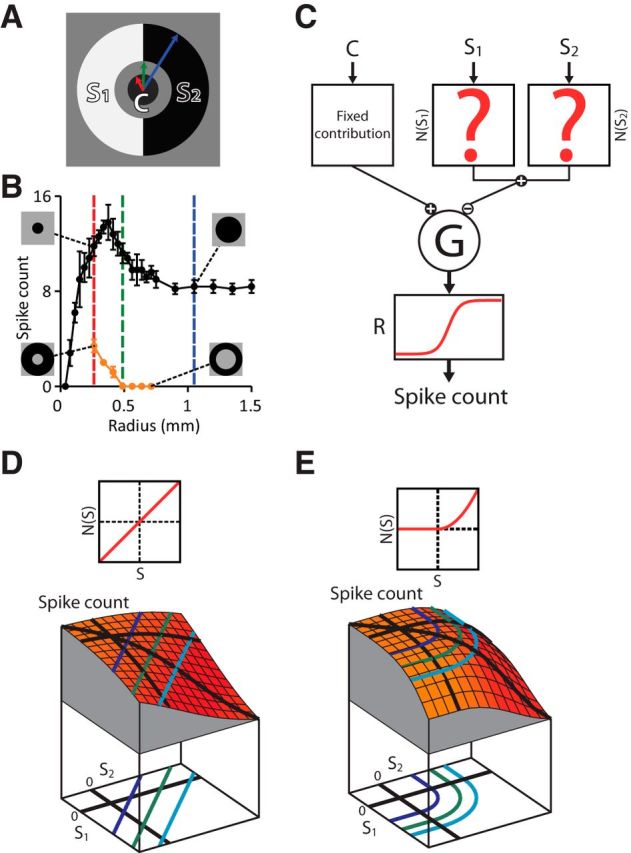
Figure 1.

Strategy of iso-response measurements for characterizing stimulus integration in the receptive field surround. A, Stimulus structure to study surround integration. The receptive field surround is divided into two regions and stimulated with two contrast values, S1 and S2, whereas the receptive field center is stimulated with a fixed contrast value, C. Note that there is a gap between the center and surround to avoid the region where excitatory and inhibitory effects have similar strength. B, Example for assessing the size of the receptive field center and surround of a recorded ganglion cell. The responses to spot stimuli with different radius (black curve) were used to determine the radius of the center spot (red dashed line) and the outer radius of the surround annulus (blue dashed line). The responses to annuli with different inner radius (orange curve) were used to determine the inner radius of the surround annulus (green dashed line). C, Subunit model consisting of an input unit for the receptive field center and two subunits for the surround. We consider a fixed input C to the center and vary the inputs to the surround subunits, S1 and S2. These two inputs are first transformed and then integrated to yield N(S1) + N(S2). This signal is combined with the center signal and fed into an output nonlinearity R, which determines the model's output spike count. D, Simulated stimulus-response relation for the subunit model with linear integration. Top, Shape of the subunit transformation N(·), which here is simply the identity. Bottom, Stimulus–response plot with iso-response curves projected below. The shape of iso-response curves (straight lines) reflects the linear integration of the surround subunits. E, Same as D, but each surround subunit transforms its input with a threshold-quadratic nonlinearity (top), which corresponds to the summation of squared positive inputs. Therefore, iso-response curves (bottom) have two straight segments parallel to the axes, reflecting the threshold operation, and a circular arc in the center region, reflecting the quadratic summation.
