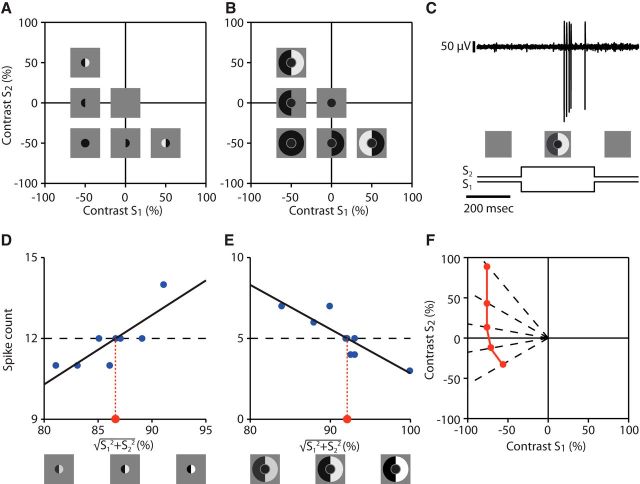
Figure 2.
Identification of iso-response curves. A, Stimulus space for assessing spatial integration in the receptive field center. The space is spanned by the contrast values S1 and S2, which are displayed in the two halves of the receptive field center. B, Stimulus space for assessing spatial integration in the receptive field surround. The space is spanned by the contrast values S1 and S2, which are displayed in the two halves of the receptive field surround, whereas the center is stimulated with fixed contrast. C, Sample voltage trace for a single stimulus presentation (top) and corresponding time course of the stimulus (bottom). D, Sample data displaying a single line search in the receptive field center for a target spike count of 12 spikes. The overall contrast level was varied with a fixed ratio of S1 to S2, corresponding to varying the radius along a fixed radial direction in the stimulus space shown in A. Linear regression (black line) was used to determine the required contrast (red dot) for reaching the target spike count. E, Same as D, but for a line search in the receptive field surround corresponding to the stimulus space shown in B. Note that, here, the spike count decreases as the overall contrast level increases. F, Schematic illustration of the buildup of an iso-response curve (red line) through successively identified stimuli (red dots) along different radial directions (dashed lines) that yield the same target spike count.

