Figure 4.
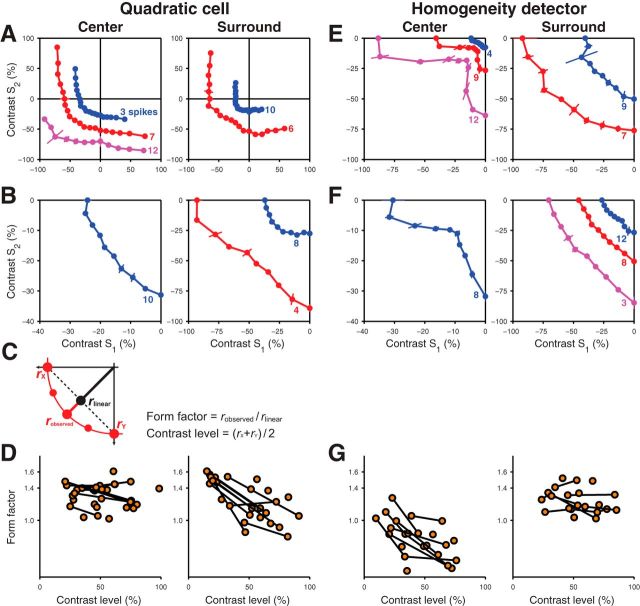
Dependence of the shape of iso-response curves on the overall contrast level. A, B, Examples with multiple measured iso-response curves for two different quadratic cells showing measurements in the receptive field center (left) and surround (right). Note that, in B, searches were restricted to the lower left quadrant of stimulus space. C, Definition of the form factor based on the measurements of an iso-response curve (red) and the linear interpolation of the curve's intersection with the axes (dashed black line). Along the lower left diagonal, the radii of the iso-response curve and of the linear interpolation are denoted as robserved and rlinear, respectively. Their ratio defines the form factor, whereas the overall contrast level was represented by the average contrast of the curve's intersection with the axes, rx and ry. D, Dependence of form factors on contrast level for quadratic cells measured for the receptive field center (left) and surround (right). Data points obtained from the same cell are connected by black lines. Ticks on the vertical axes denote values corresponding to linear, quadratic and cubic integration (1.0, ≈ 1.4 and 22/3 ≈ 1.6, respectively). E, F, Examples with multiple measured iso-response curves for two different homogeneity detectors with searches restricted to the lower left quadrant of stimulus space. G, Form factors for homogeneity detectors plotted against the overall contrast level.

