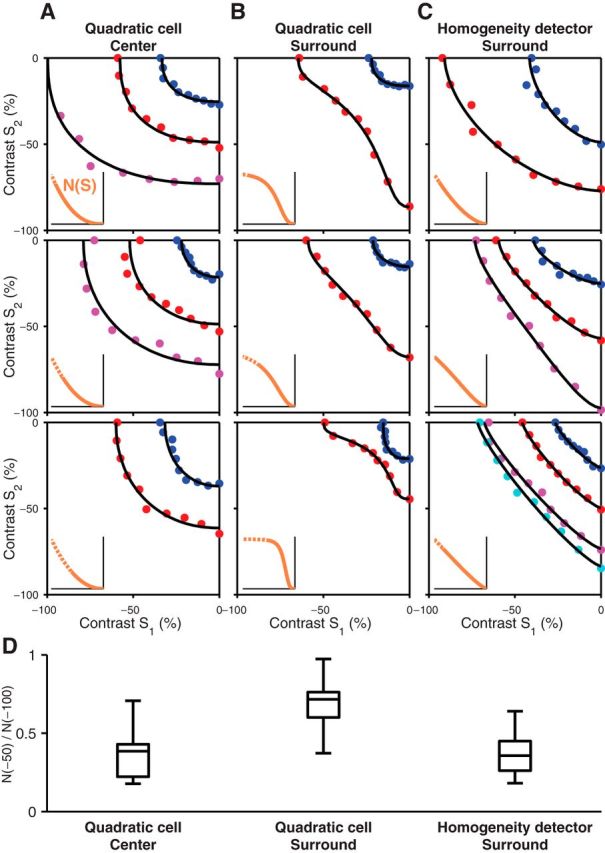
Figure 5.

Extraction of subunit nonlinearities by fitting iso-response curves with a subunit model. A–C, Three examples are shown for the quadratic cell centers (A), quadratic cell surrounds (B), and homogeneity detector surrounds (C). Each panel shows multiple iso-response curves measured in the lower left quadrant of stimulus space (colored dots) together with model-derived iso-response curves (solid black lines) obtained by optimizing the subunit nonlinearity, N(S), shown by the orange line in the inset. The dashed lines in the insets represent parts of the subunit nonlinearities outside of the contrast range that was covered by the identified iso-response stimuli. D, Analysis of the saturation of the extracted subunit nonlinearities. For each subunit nonlinearity N(S), we calculated the saturation ratio N(−50)/N(−100) and compared the distributions of saturation ratios for the center and surround of quadratic cells and for the surround of homogeneity detectors. The box plots depict the median, the 25th and 75th percentiles, and the total range of the saturation ratio for each distribution.
