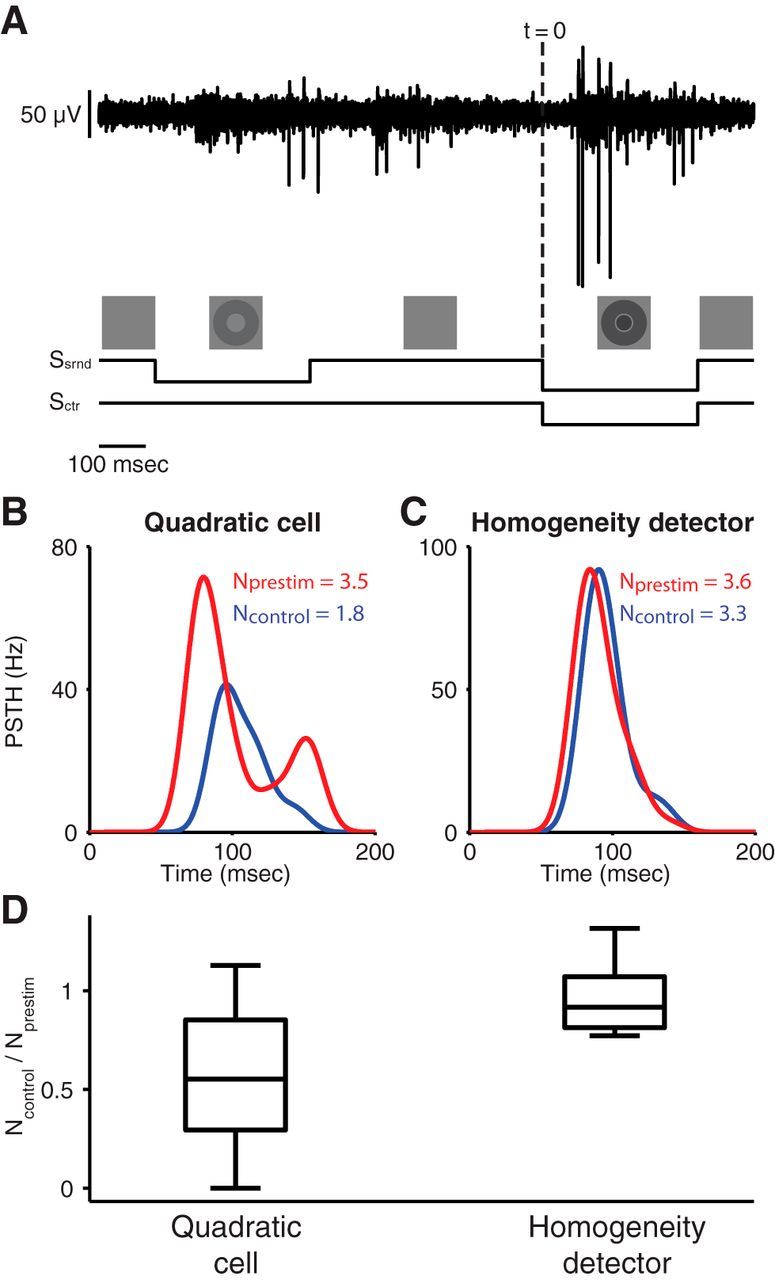
Figure 6.

Test for surround adaptation by applying a prestimulus to the surround. A, Sample voltage trace (top) and stimulus layout (bottom). A test stimulus consisted of a center and a surround component (−50% and −70% contrast, respectively). In the prestimulus condition, this was preceded by a sole stimulation of the surround (−40% contrast), which terminated 500 ms before the onset of the test stimulus. In the control condition, only the test stimulus was presented. B, Sample peristimulus time histograms (PSTH) obtained from a quadratic cell for the prestimulus (red) and control (blue) conditions. Time 0 corresponds to the onset of the test stimulus (dashed line in A). The average spike counts for the two conditions, Nprestim and Ncontrol, are denoted in the plot. C, Sample PSTH obtained from a homogeneity detector for the prestimulus (red) and control (blue) conditions. D, Comparison of the effects of the prestimulus on spike counts for quadratic cells and homogeneity detectors. For each recorded cell, the spike count ratio Ncontrol/Nprestim was calculated and the box plots depict the median, the 25th and 75th percentiles, and the total range of these spike count ratios for the two distinguished cell types.
