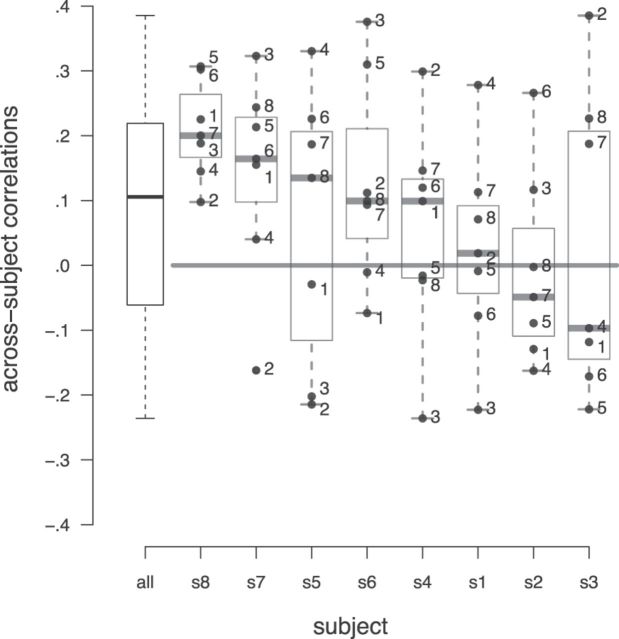
Figure 8.
Prediction performance across participants. Each boxplot shows the prediction accuracy for an SVR model trained on one subject, predicting the preferences for all 120 items for the other seven subjects. Boxplot on the far left shows distribution of all 56 correlations obtained in this way. Error bars in boxes show the median prediction performance.

