
Figure 6.
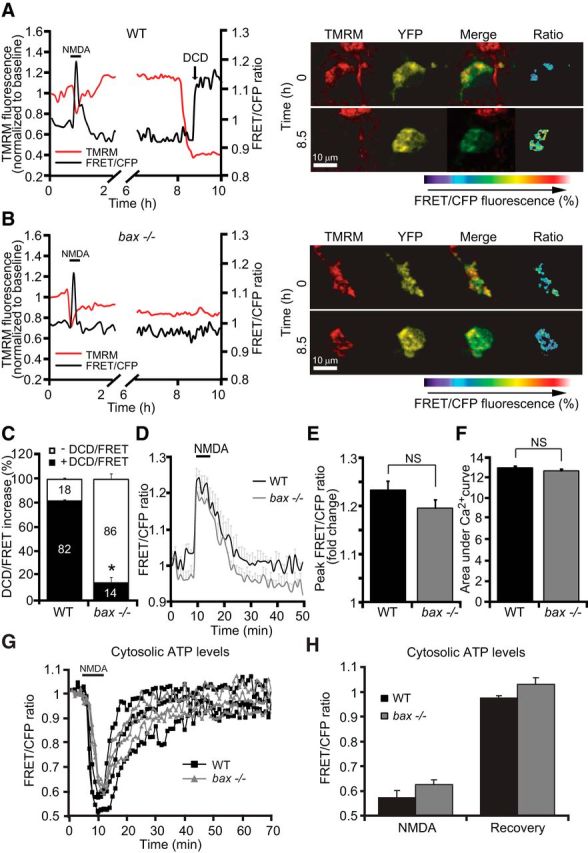
bax deficiency does not influence free mitochondrial matrix Ca2+ levels and does not prevent ATP depletion during NMDA excitation. Cortical neurons derived from WT and bax−/− mice were transfected with either the mitochondrial Ca2+ sensor FRET probe (mtcD2cpv) and after 24 h mounted on the stage of a LSM 710 microscope or the ATP-sensitive (ATeam) FRET probe and after 24 h mounted on the stage of a LSM 5Live duoscan microscope. Fluorescent measurements were recorded for TMRM, FRET, CFP, and YFP by time-lapse confocal microscope. FRET probe imaging data are expressed as a ratio of FRET/CFP. TMRM was used as a Δψm indicator (nonquenched mode). A, B, WT and bax−/− cortical neurons transfected with the mitochondrial Ca2+ sensor FRET probe were then treated with 100 μm NMDA for 5 min and assayed over 24 h. Representative traces and corresponding images of NMDA-treated neurons depicting the extent of peak mitochondrial Ca2+ influx at point of stimulation (100 μm/5 min NMDA) and at later time points are illustrated. In neurons that showed a delayed excitotoxicity (A), we observed significant mitochondrial calcium accumulation (FRET probe activation) simultaneously with a delayed Δψm depolarization. In contrast, bax−/− neurons (B) that were tolerant to excitotoxic injury did not show a detectable FRET probe activation. C, Quantification of neurons showing DCD/FRET increase in WT (n = 32) and bax−/− (n = 40) neurons is shown. D, Means of three single cells representative traces ± SEM of WT and bax−/− mitochondrial Ca2+ kinetics before, during, and after NMDA excitation (100 μm/5 min NMDA) are shown. E, F, Mean peak FRET/CFP ratio (E) and mean area under mitochondrial Ca2+ curve (F) between the genotypes (n = 47 and 46 neurons for WT and bax−/−, respectively) during NMDA exposure are quantified. Data are means ± SEM from at least n = 3 independent experiments (p ≤ 0.05; ANOVA, post hoc Tukey). G, H, WT and bax−/− cortical neurons were separately transfected with the ATP-sensitive (ATeam) FRET probe, treated with 100 μm NMDA for 5 min, and assayed over 2–3 h. Time-lapse confocal microscopy experiments indicated no difference in cytosolic ATP levels between neurons derived from WT (n = 26) and bax−/− (n = 30) mice during the NMDA exposure and recovery time period (time = 50 min). Means ± SEM are shown from at least n = 3 independent experiments (p ≤ 0.05; ANOVA, post hoc Tukey).