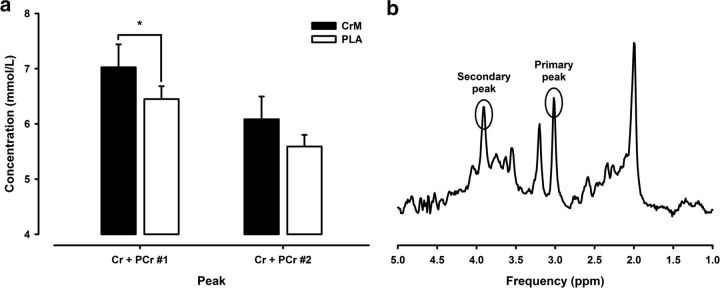
Figure 2.
Neural creatine concentration after supplementation. a, Mean Cr concentration detected in the sensorimotor cortex increased after 1 week of dietary CrM supplementation (black bars) compared to PLA (white bars). Data were recorded using 1H MRS, transformed to an absolute quantity (in millimoles per liter) and corrected for the proportion of gray and white matter present in the volume of interest. Bars show the mean ± SEM. *p < 0.05. b, Amplitude of the Cr + PCr peaks from 1H MRS. An example spectra acquired at 3 T from the sensorimotor cortex of one participant is shown. Resonances at 3.069 and 3.960 ppm represent the primary and secondary Cr + PCr peaks, respectively.

