
Figure 1.
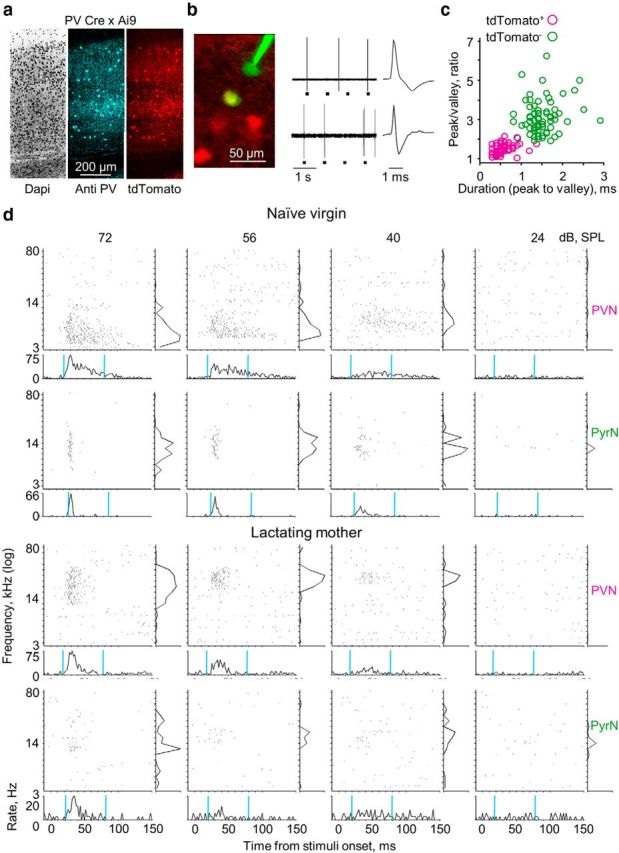
Single-cell recordings of PVNs and PyrNs. a, Immunohistochemical confirmation of parvalbumin-expressing IN labeling in PV–Cre;Ai9 double-heterozygous mice (A1 coronal sections of 40 μm). The vast majority (144 of 145) of tdTomato+ cells were labeled by the anti-PV antibodies. b, Representative examples of targeted recordings (top, tdTomato− cell; bottom, tdTomato+ cell). Left, Confirmation of electrode targeting. Two-photon micrograph of tdTomato+ cells (red) and the recording electrode (Alexa Fluor-488, green). The yellow cell is a tdTomato+ cell after targeted recording and injection of green dye from the electrode. Middle, Electrical recording of spike output of tdTomato− (top) and tdTomato+ (bottom) cells that are shown at the two-photon micrograph on the left (gray rectangles indicate tone stimuli). Right, Individual spike waveforms. c, Spike waveform analysis. Cells expressing tdTomato had characteristic low peak/valley ratio <2 (71 of 73 cells) and fast peak to valley duration <1 ms (71 of 73 cells). tdTomato− cells had a higher peak/valley ratio >2 (68 of 74 cells) and slower peak to valley duration >1 ms (70 of 74 cells). d, Four examples of single-cell responses. The two cell types are each from a single mouse (1 pair per experimental group). For each plot, the top are raster plots in response to pure tones shown separately for all SPLs, and the bottom shows PSTHs by SPL (spikes/2 ms bins, relative to response at 72 dB SPL). The cyan vertical lines indicate a 60 ms response window starting from the calculated time of response latency. Right, Frequency tuning curve (evoked spikes/stimulus, normalized to response at 72 dB SPL).