
Figure 2.
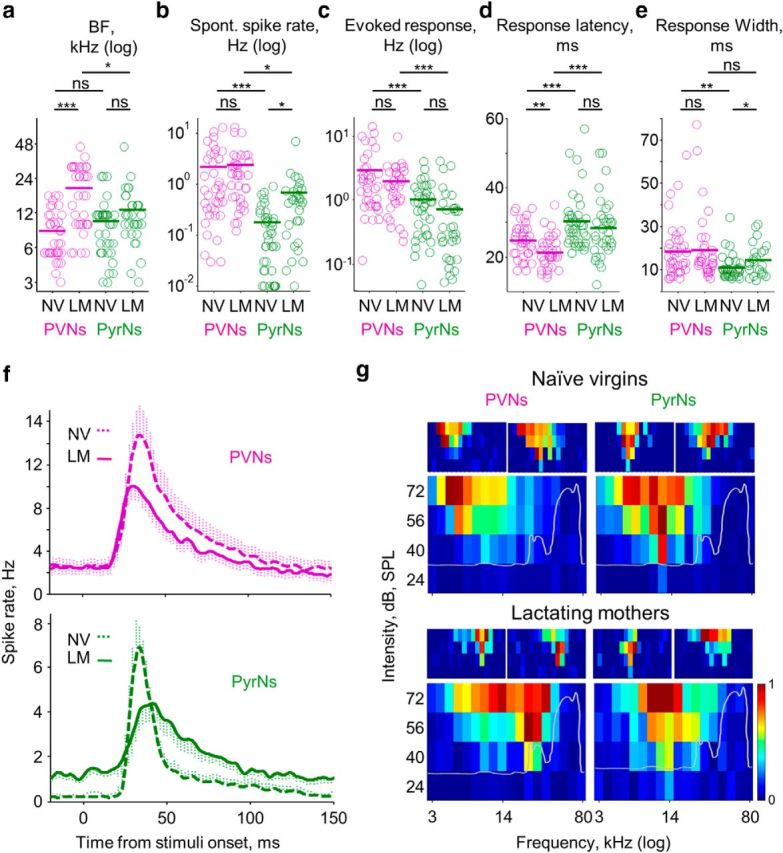
Response properties of PVNs and PyrNs in lactating mothers. a–e, Comparative analysis of PVN (magenta) and PyrN (green) response properties in the two experimental groups (Table 1). Each circle represents an individual cell (NV, naive virgins; LM, lactating mothers). The bold line is the mean ± SEM (2 × 2 ANOVA, two-tailed post hoc t test; *p < 0.016, **p < 0.0033, ***p < 0.00033; Table 2). f, Mean PSTHs of all PVNs (top, magenta) and PyrNs (bottom, green) from both experimental groups (collapsed for all tones and all intensities, binned at spikes/2 ms bins). g, FRAs by cell type and experimental group. The larger FRA (bottom) is the mean normalized FRAs of all cells recorded in that experimental group. Two representative examples of single-cell FRAs are shown on the top. The gray line superimposed on the mean FRAs show the spectral-intensity curve of PV × Ai9 5-d-old pup calls (mean of 6 calls from 3 pups).