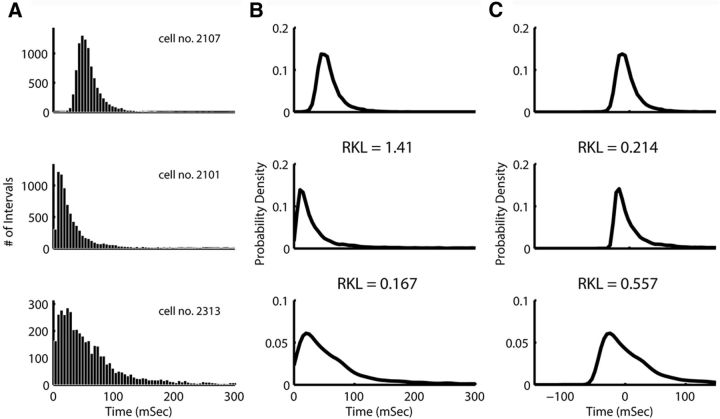
Figure 2.
ISI distribution analysis. A, ISI histograms of three cells, 5 ms bins. B, PDF of those cells ISIs. C, PDF of the median-normalized ISIs (ISI − median ISI); the RKL distance between pairs of PDFs is given between the plots (thus, first RKL is the distance between the 1st and 2nd plot). When distance is taken on the non-normalized PDF, the second cell is much closer to the third than to the first. Using the MN-PDF makes the second cell much closer to the first, which corresponds to our intuition.

