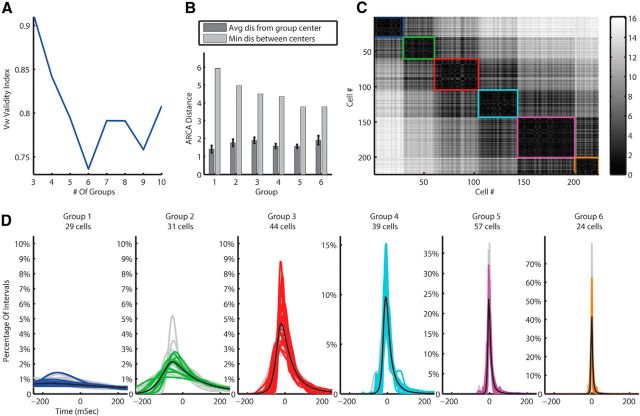
Figure 4.
MN-PDF clustering results for all data using the Hellinger metric. A, Vw cluster validity suggest six clusters in the data. B, Separation statistics; the average (with SEM indicated by error bars) distance between MN-PDFs within groups compared with the distance of the group center to the next nearest center. C, The ARCA distances matrix of all cells. Black is zero and white is a large distance. Each group is marked by a square with the same color as in D. D, The MN-PDFs of all cells in the training and testing data divided into groups by the clustering algorithm. The training data are in gray in the background and the testing data in color.

