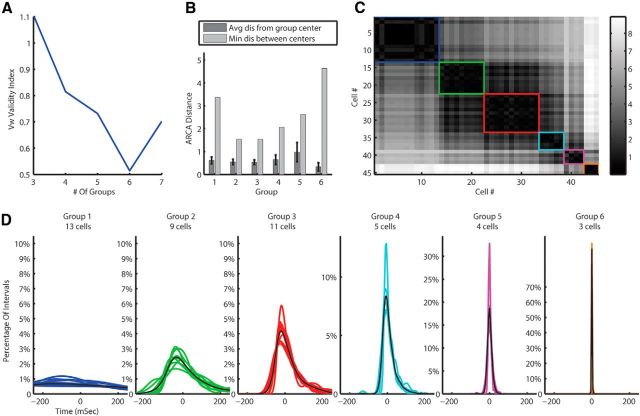
Figure 8.
MN-PDF clustering results for mice juxtacellular data using the RKL metric. A, Vw cluster validity suggest six clusters in the data. B, Separation statistics; the average (with SEM indicated by error bars) distance between MN-PDFs within groups compared with the distance of the group center to the next nearest center. C, The ARCA distances matrix of all cells. Black is zero and white is a large distance. Each group is marked by a square with the same color as in D. D, The MN-PDFs of all cells in the mice juxtacellular data divided into groups by the clustering algorithm.

