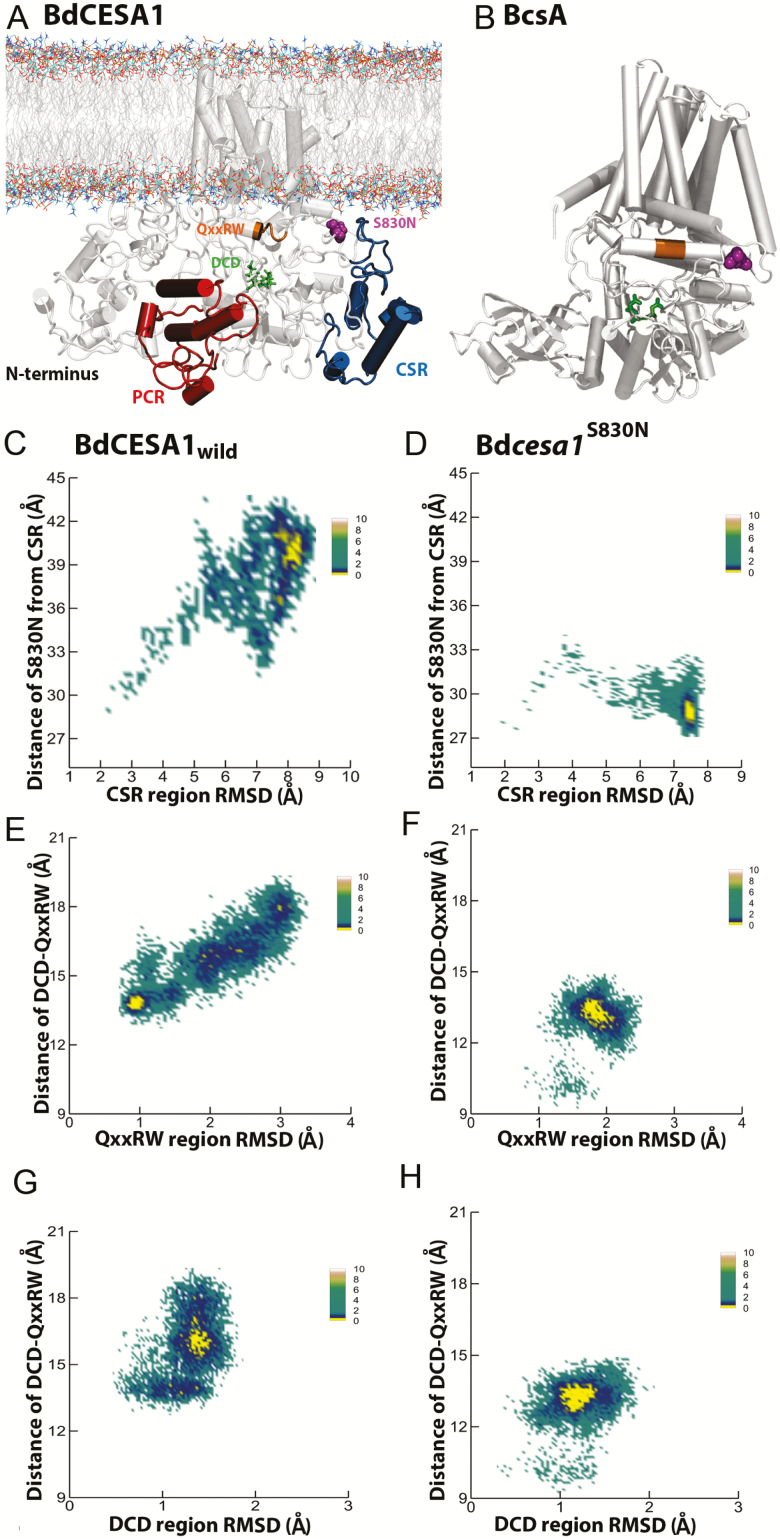
Figure 5.
The location of S830 in the BdCESA1 model (A) and the BscA model (B). The mutation site is coloured magenta, DCD motif is green and QxxRW is orange. In BdCESA1 model the PCR is red and CSR is blue. BscA does not have PCR and CSR. (C, D) Conformational sampling of the CSR region as function of distance from mutation site and root-mean-square deviation for wild-type and mutant, respectively. (E, F) Conformational sampling of QxxRW region as a function of distance from the DCD site and root-mean-square deviation for wild-type and mutant, respectively. (G, H) Conformational sampling of the DCD region as function of distance from the QxxRW and root-mean-square deviation for wild-type and mutant, respectively. Conformational spaces (C–H) are coloured based on free energy with yellow being lowest energy state.

