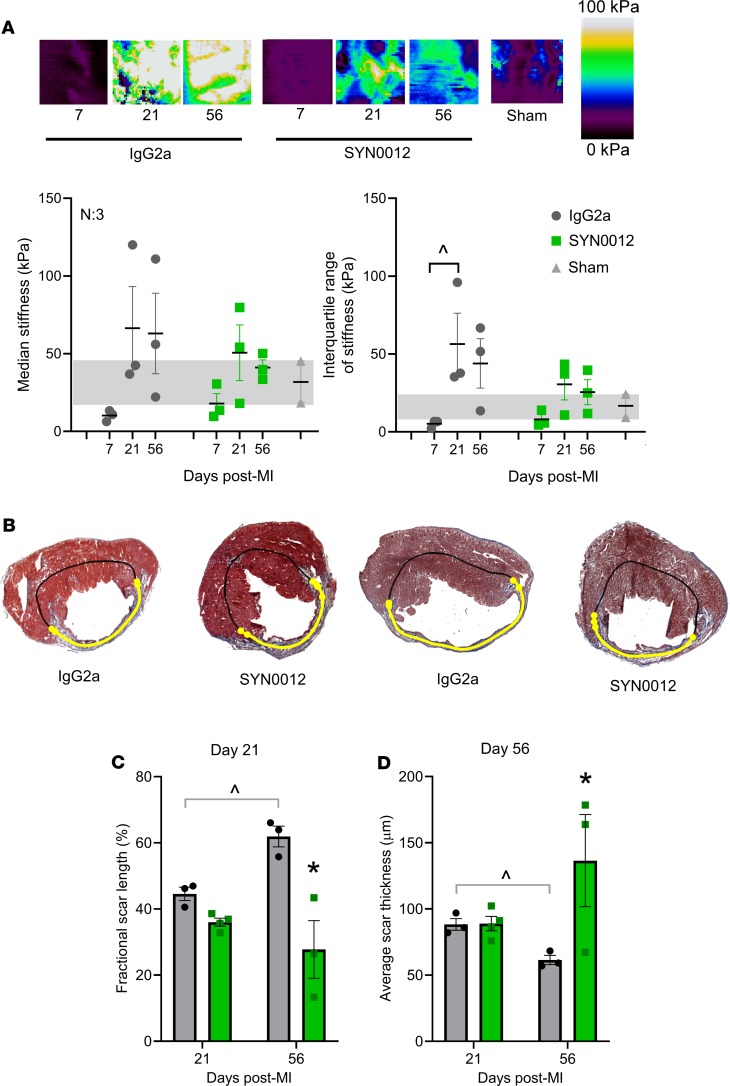
Figure 4. CDH11 blockade limits fibrotic remodeling after MI.
Atomic force microscopy was used to quantify local tissue stiffness, as shown by representative stiffness color maps (A). Calculation of median stiffness values from each scan revealed a decrease at 7 days after MI, with all of the IgG2a hearts falling outside the range of the sham myocardium. Median stiffness values increased by 21 days and remained elevated out to 56 days in IgG2a-treated hearts, whereas SYN0012-treated hearts increased to a lesser extent at 21 days and were restored to sham levels by 56 days after MI; the interquartile range of stiffness values was larger in IgG2a-treated infarcts than SYN0012-treated infarcts, which were similar to the range of sham myocardium. Representative Masson’s trichrome–stained sections denote scar location (yellow line), as identified by a custom image processing algorithm (B). Images were used to quantify the fractional scar length as a percentage of cardiac circumference (C) and the average thickness along the infarct length (D). Data are presented as mean ± SEM; each dot represents the average of either 5 independent measurements (A) or 3 independent images (C and D) from individual animals, with n = 3–4. Significance was determined by 2-way ANOVA with Holm-Sidak’s multiple comparison test. *P < 0.05 between treatments, ^P < 0.05 between time points

