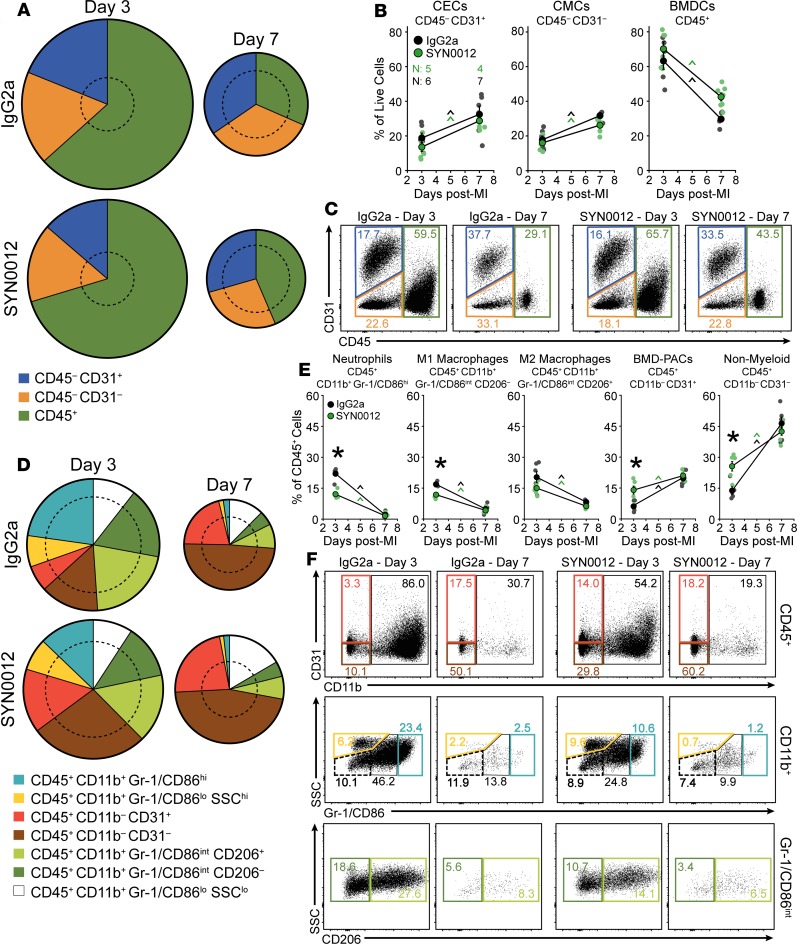
Figure 5. CDH11 blockade modulates expression of specific cell populations after MI.
CDH11 blockade by SYN0012 treatment does not significantly alter the percentages of non-CM populations (cardiac endothelial cells [CECs], cardiac mesenchymal cells [CMCs], and bone marrow–derived cells [BMDCs]) in the heart after MI, relative to IgG2a isotype control (A and B). Pie chart radii are scaled by the number of live single cells for each treatment and time, relative to sham hearts at day 3 (denoted by dotted circles). Representative dot plots (C) show changes in expression of each population (colored gates). Separation of BMDC populations (D) revealed that SYN0012 treatment results in a significant reduction in neutrophils (light blue) and M1-like macrophages (dark green) in addition to increased bone marrow–derived proangiogenic cells (BMD-PACs, red) and nonmyeloid BMDCs (or lymphocytes, brown) at day 3 after infarct; differences in all populations between treatments were gone by day 7 (E). Representative dot plots (F) show changes in expression of each subpopulation (colored gates). Percentages of each population, relative to all live cell events, are denoted within colored gates. Data are presented as mean ± SEM, with n = 4–7 per group; dots in B and E denote individual animals. Pie charts represent average values. Significance was determined by 2-way ANOVA with a Holms-Sidak’s multiple comparison test. *P < 0.05 between treatments at the same time, ^P < 0.05 over time; color of significance marker denotes treatment group

