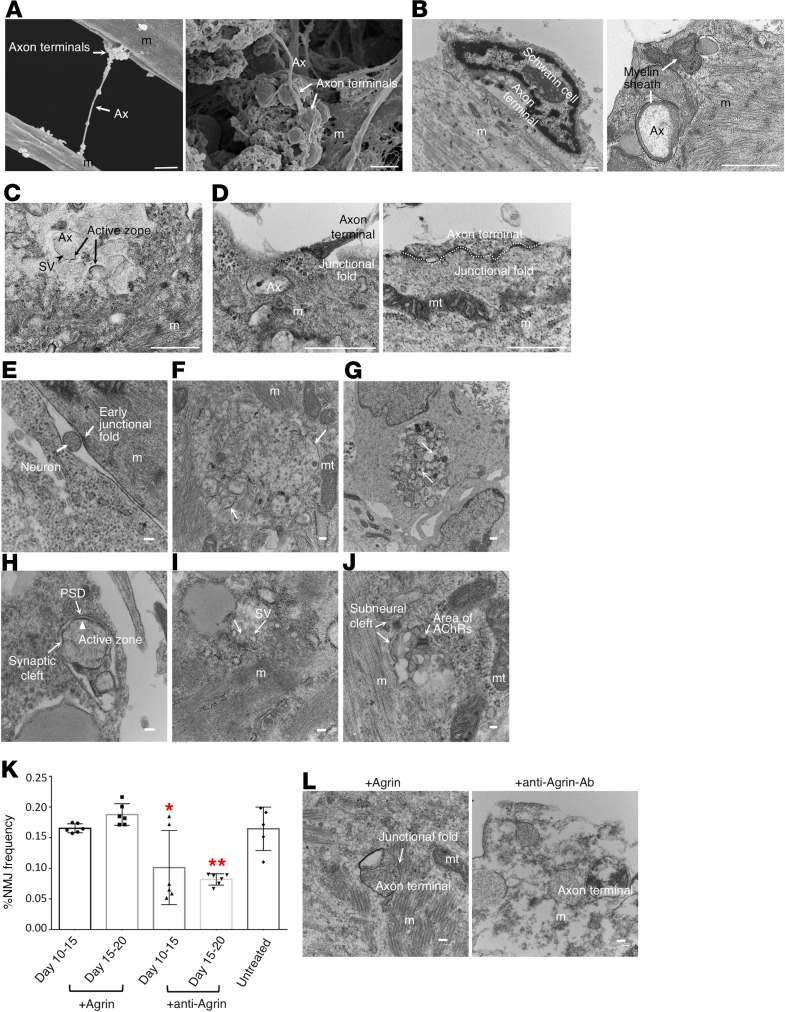
Figure 4. Fine structures of hNMJs and developmental stage analysis.
(A) Scanning electron microscopy images show swelling axon terminals binding to a myotube. (B) TEM images show a synaptic bouton capped by the terminal Schwann cell and myelinated axon. (C) The TEM image shows synaptic vesicles (arrowheads) in presynaptic sites, active zones (arrows), and mitochondria accumulated in postsynaptic sites. (D) Enlarged axon terminals observed inside a myotube. Junctional folds are seen as electron-dense areas. (E) A neuron innervating a myotube (m) and an electron-dense area observed on the muscle plasma membrane. (F) Multiply branched axon terminals observed in a myotube. Electron-dense areas (arrows) locate at each axon terminal. Mitochondria (mt) are found nearby. (G) Necrosis was observed among the axon terminals (arrows). (H) An active zone (arrowhead) juxtaposed to the postsynaptic density (PSD, arrow) with a synaptic cleft observed in between. (I) Synaptic vesicles (SV) docked to the active zone (arrows). (J) A subneural cleft surrounded by sarcolemma with AChRs residing inside. (K) NMJ frequencies with agrin and antiagrin treatment in NMJ cultures at day 30. See also Supplemental Figure 8. (L) Change in NMJ morphology with agrin or antiagrin antibody treatment. Scale bars: 1 μm (A–D), 100 nm (E–J and L). (K) *P < 0.05; **P < 0.01 (1-way ANOVA with Tukey’s test relative to untreated control). Data are shown as mean ± SEM; n = 6 (agrin and antiagrin); n = 5 (untreated control). Each dot represents a biologically independent sample.

